


USD/INR Price Analysis: Bulls moving in for prospects of a weekly correction
- USD/INR bulls are on the move, but a wall of resistance lies ahead.
- The bears are looking deeper into the picture that involves a bearish prospect in US 10-year yields.
The bulls could well be moving in for the kill soon considering the correction's depth and deceleration at the 38.2% Fibonacci retracement level which is acting as support, currently.
USD/INR daily chart
-637785920732915621.png)
The bulls will look to a 75.20 target where the old structure falls in near prior resistance looking left. A break there would be significantly bullish for the weeks ahead.
USD/INR weekly chart
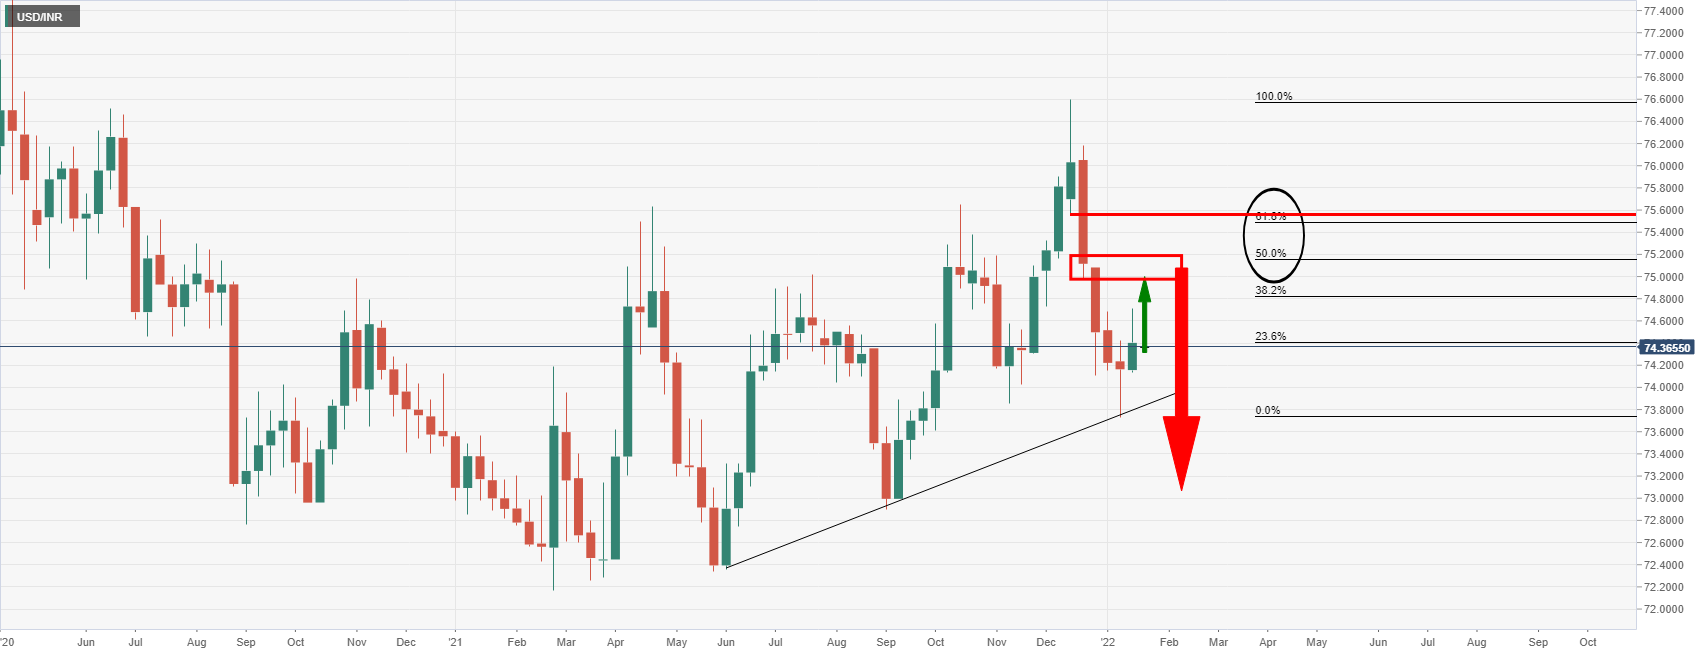
The weekly chart, on the other hand, shows that the price is merely correcting a dominant weekly bearish impulse. A correction into the 50% mean reversion area near the said 75.20 target, could equate to resistance and result in a downside test of the trendline resistance and a potential follow-through for the weeks ahead. 72.80 would be eyed in this scenario.
Looking to the US dollar, there are prospects of a shift to the downside if the market has overpriced the Fed and if yields fall. The weekly chart in Us ten year yields, in this regards is compelling:
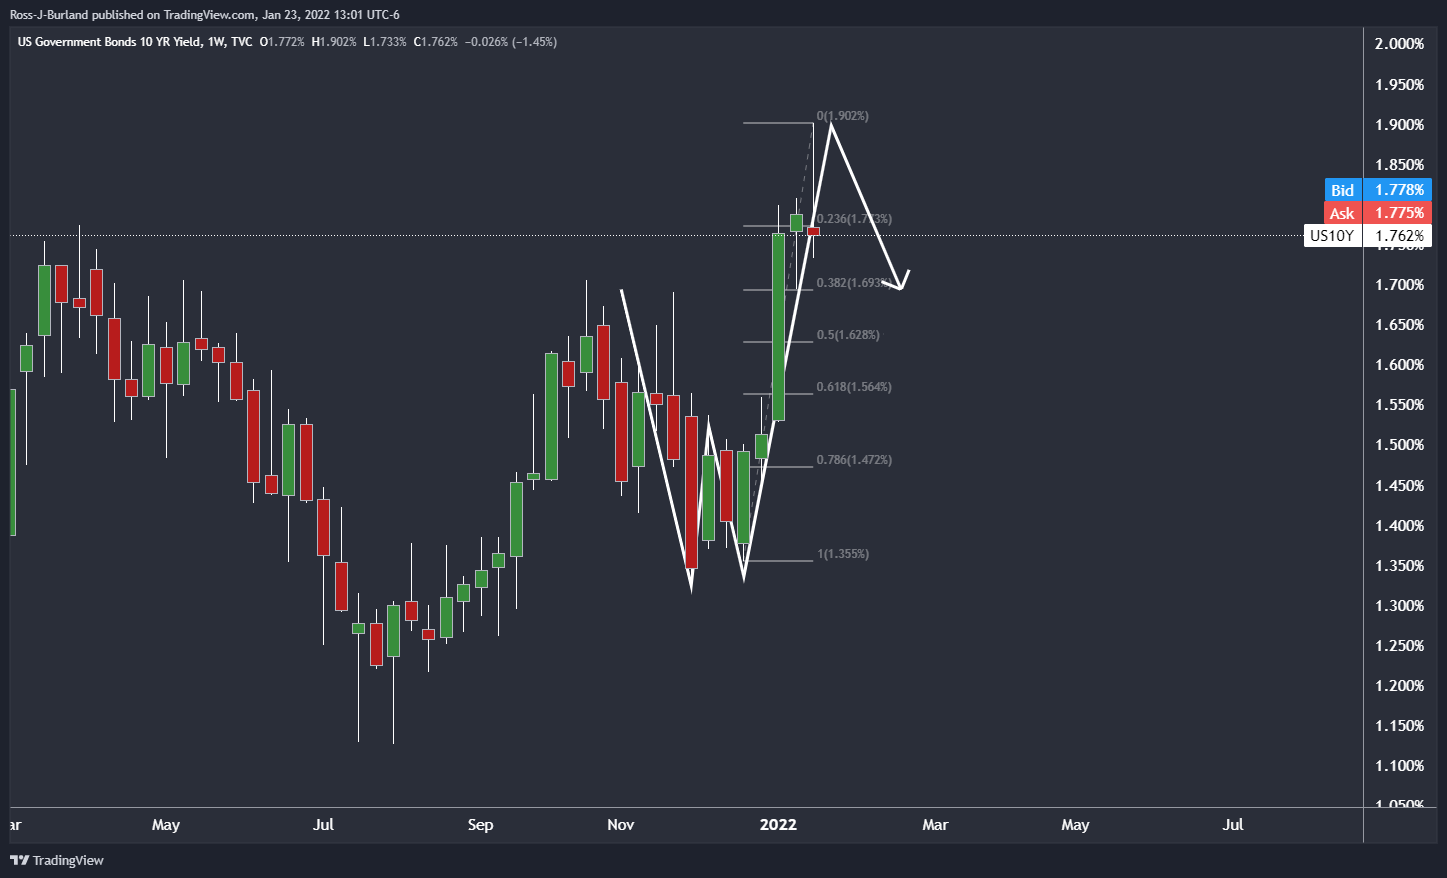
This W-formation is a reversion pattern that has a high completion rate on a fractal basis, ie,e, across all time frames. The price tends to retrace back to the neckline, or, in the case of an overextended-W. In this scenario, the 38.2% Fibonacci aligns with the prior highs around the 1.70s%. that would be highly bearish for the US dollar:
DXY weekly chart
If this is a retest in a low volume rally before the markdown, then the dollar could be headed much lower in the weeks to come.
The weekly chart is compelling in this regard:
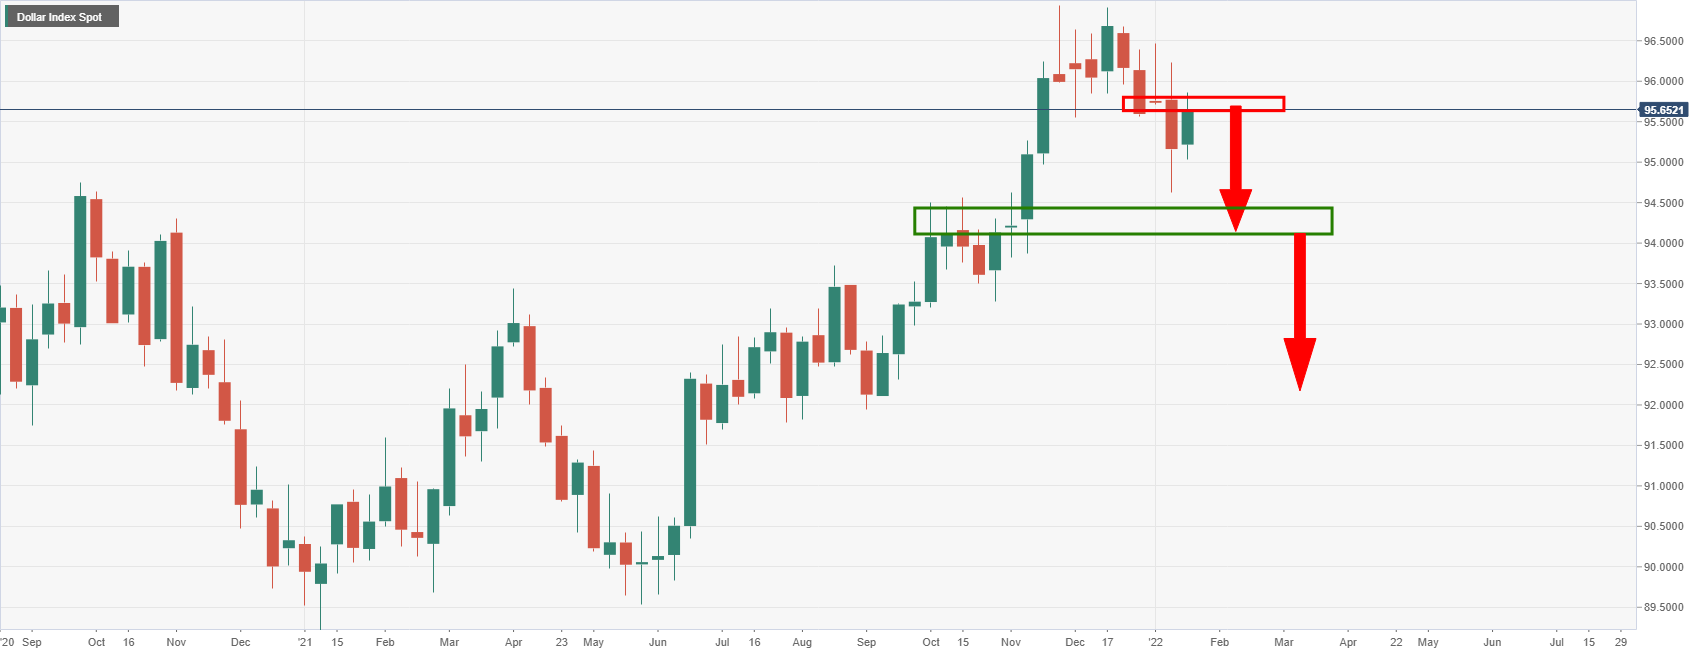
Old highs near 94.50 and then a retest of 92 on the longer-term outlook would significantly dent USD/INR.