USD/CAD Price Analysis: Finds support near 1.3500 as Oil price edge down
- USD/CAD finds cushion near 1.3500 as Oil prices drop on tighter supply concerns.
- The US Dollar moves higher while risk-sensitive currencies edge down amid uncertainty ahead of US data.
- The Loonie is expected to blow out of the ascending Triangle formation.
The USD/CAD pair discovers a temporary support near the psychological support of 1.3500 in the European session on Monday. The Loonie asset finds cushion as the Oil prices edge down after a three-day rally.
The appeal for the Oil prices remains buoyant on tighter supply concerns. OPEC pledges to extend production cuts by the June end. Also, Ukraine’s drone attacks on some Russian refineries have deepened supply concerns. It is worth noting that Canada is the leading exporter of oil to the United States and higher Oil prices strengthen the Canadian Dollar.
Meanwhile, the US Dollar rises slightly to 104.58 amid caution ahead of the United States Nonfarm Payrolls (NFP) and related labor market data this week. The market is experiencing asset-specific action as risk-perceived currencies are down while US equity futures have posted significant gains.
In today’s session, investors will focus on the United States ISM Manufacturing PMI data for March, which will be published at 14:00 GMT. The factory data is estimated to increase to 48.4 from 47.8 in February.
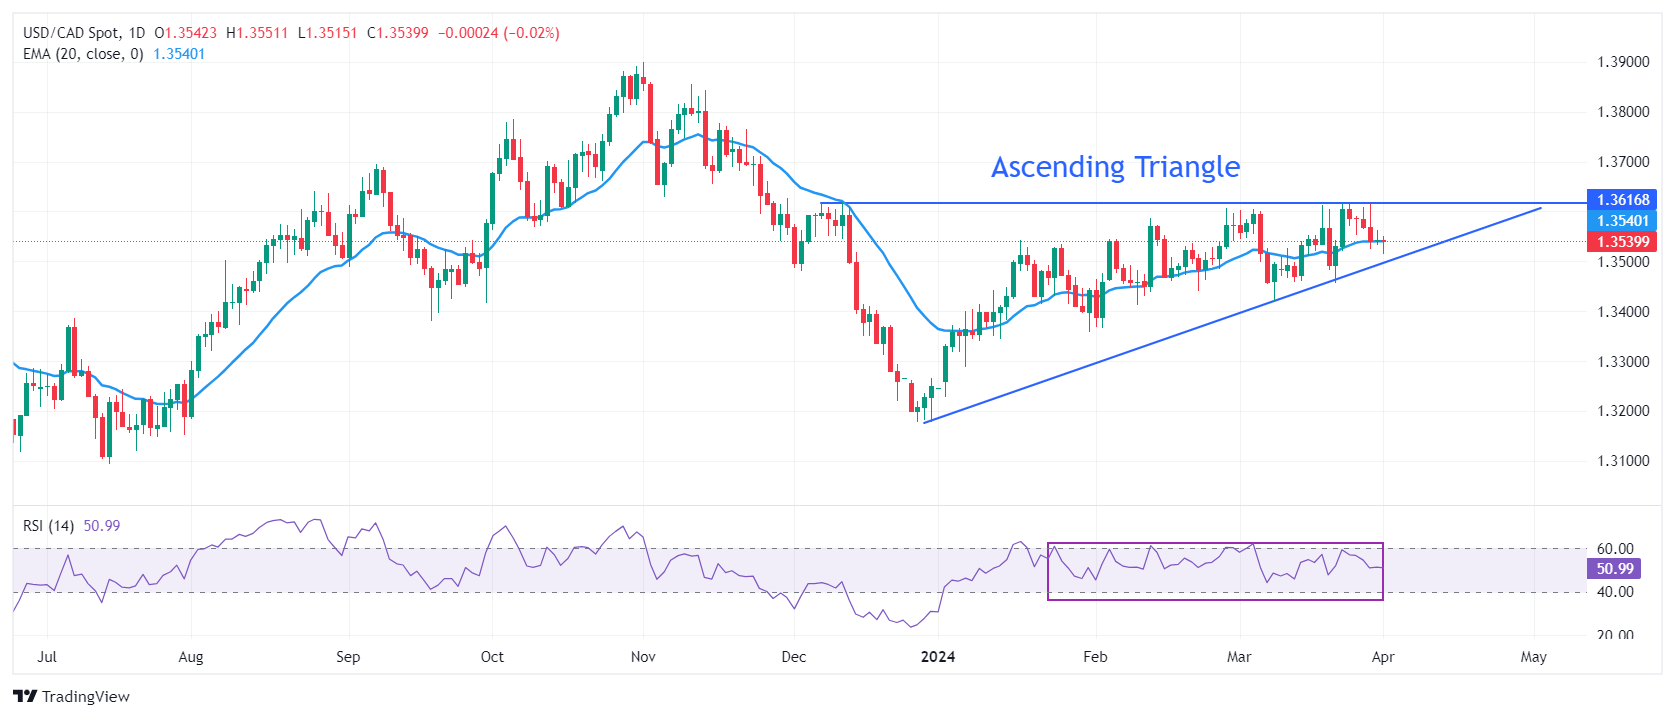
USD/CAD seems close to exploding the Ascending Triangle pattern formed on a daily time. The chart pattern exhibits a sharp volatility contraction. The upward-sloping border of the aforementioned pattern is placed from December 27 low at 1.3177 while horizontal resistance is plotted from December 7 high at 1.3620
The 20-day Exponential Moving Average (EMA) near 1.3520 remains stick to spot prices, indicating a consolidation ahead.
The 14-period Relative Strength Index (RSI) oscillates inside the 40.00-60.00 range, indicating indecisiveness among investors.
The Loonie asset would observe a fresh upside if it breaks above December 7 high at 1.3620. This will drive the asset towards May 26 high at 1.3655, followed by the round-level resistance of 1.3700.
On the flip side, a downside move below February 22 low at 1.3441 would expose the asset to February 9 low at 1.3413. A breakdown below the latter would extend downside towards January 15 low at 1.3382.
USD/CAD daily chart


