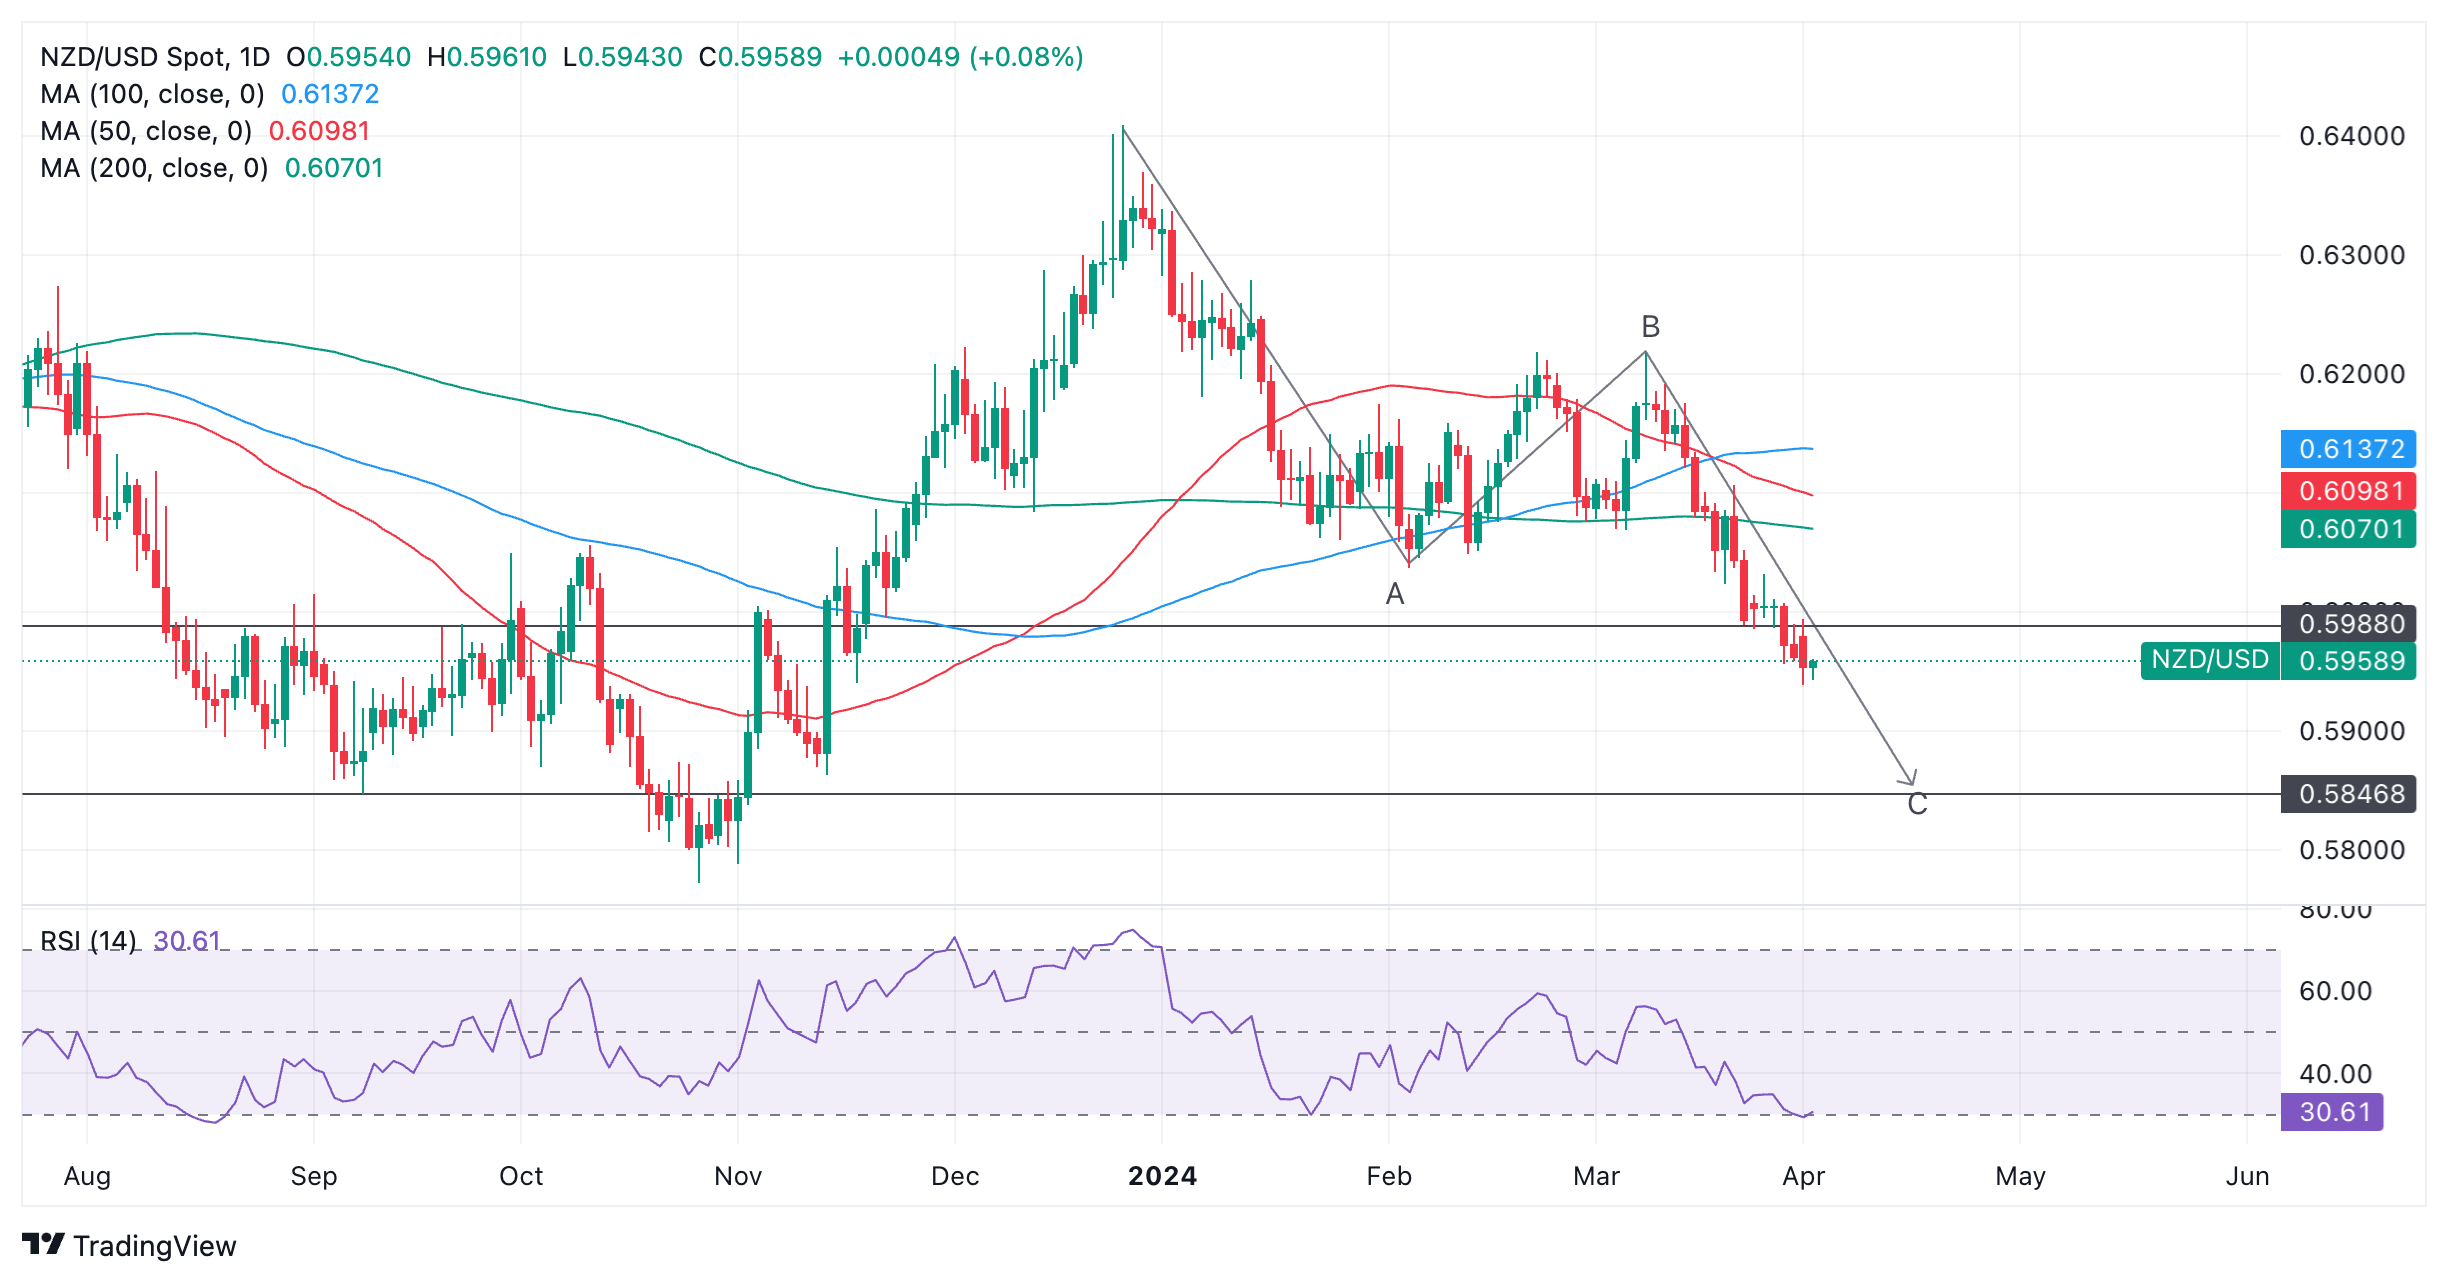
NZD/USD Price Analysis: Bearish pattern unfolding
- NZD/USD is declining in the final C leg of a bearish pattern.
- The Measured Move is likely to fall to a target in the 0.5800s.
- The RSI is oversold on the daily chart suggesting a risk of a pullback.
NZD/USD is falling in a bearish three-wave pattern, known as a Measured Move. This type of pattern consists of three waves, usually labeled ABC, in which wave A and C are commonly of the same length – or related by a Fibonacci ratio.
New Zealand Dollar versus US Dollar: Daily chart
Assuming the pattern unfolds as expected, NZD/USD is likely to fall to a target at roughly 0.5847, corresponding to the end of wave C.
NZD/USD has already broken below the conservative target for the pattern at 0.5988, measured as wave C being equal to a 0.618 Fibonacci ratio of wave A.
The pair is in a short-term downtrend which, according to the adage that “the trend is your friend,” is likely to continue.
The Relative Strength Index (RSI) momentum indicator, fixed at 29.32 on Monday’s close, is oversold which means there is now a risk of a pullback occurring.
If the RSI exits oversold it will signal the price will probably rise and traders should close their short bets and open longs.
If the RSI remains below 30 in the oversold zone it will signal traders should keep their short bets open but not add to them.


