Silver Price Analysis: XAG/USD jumps back closer to YTD top, seems poised to climb further
- Silver scales higher for the fourth straight day and spikes to a one-and-half-week high.
- The technical setup favours bullish traders and supports prospects for additional gains.
- Any meaningful corrective decline is likely to find decent support near the $25.00 mark.
Silver (XAG/USD) gains positive traction for the fourth straight day on Tuesday and climbs further beyond mid-$25.00s during the first half of the European session, back closer to the YTD peak touched last week.
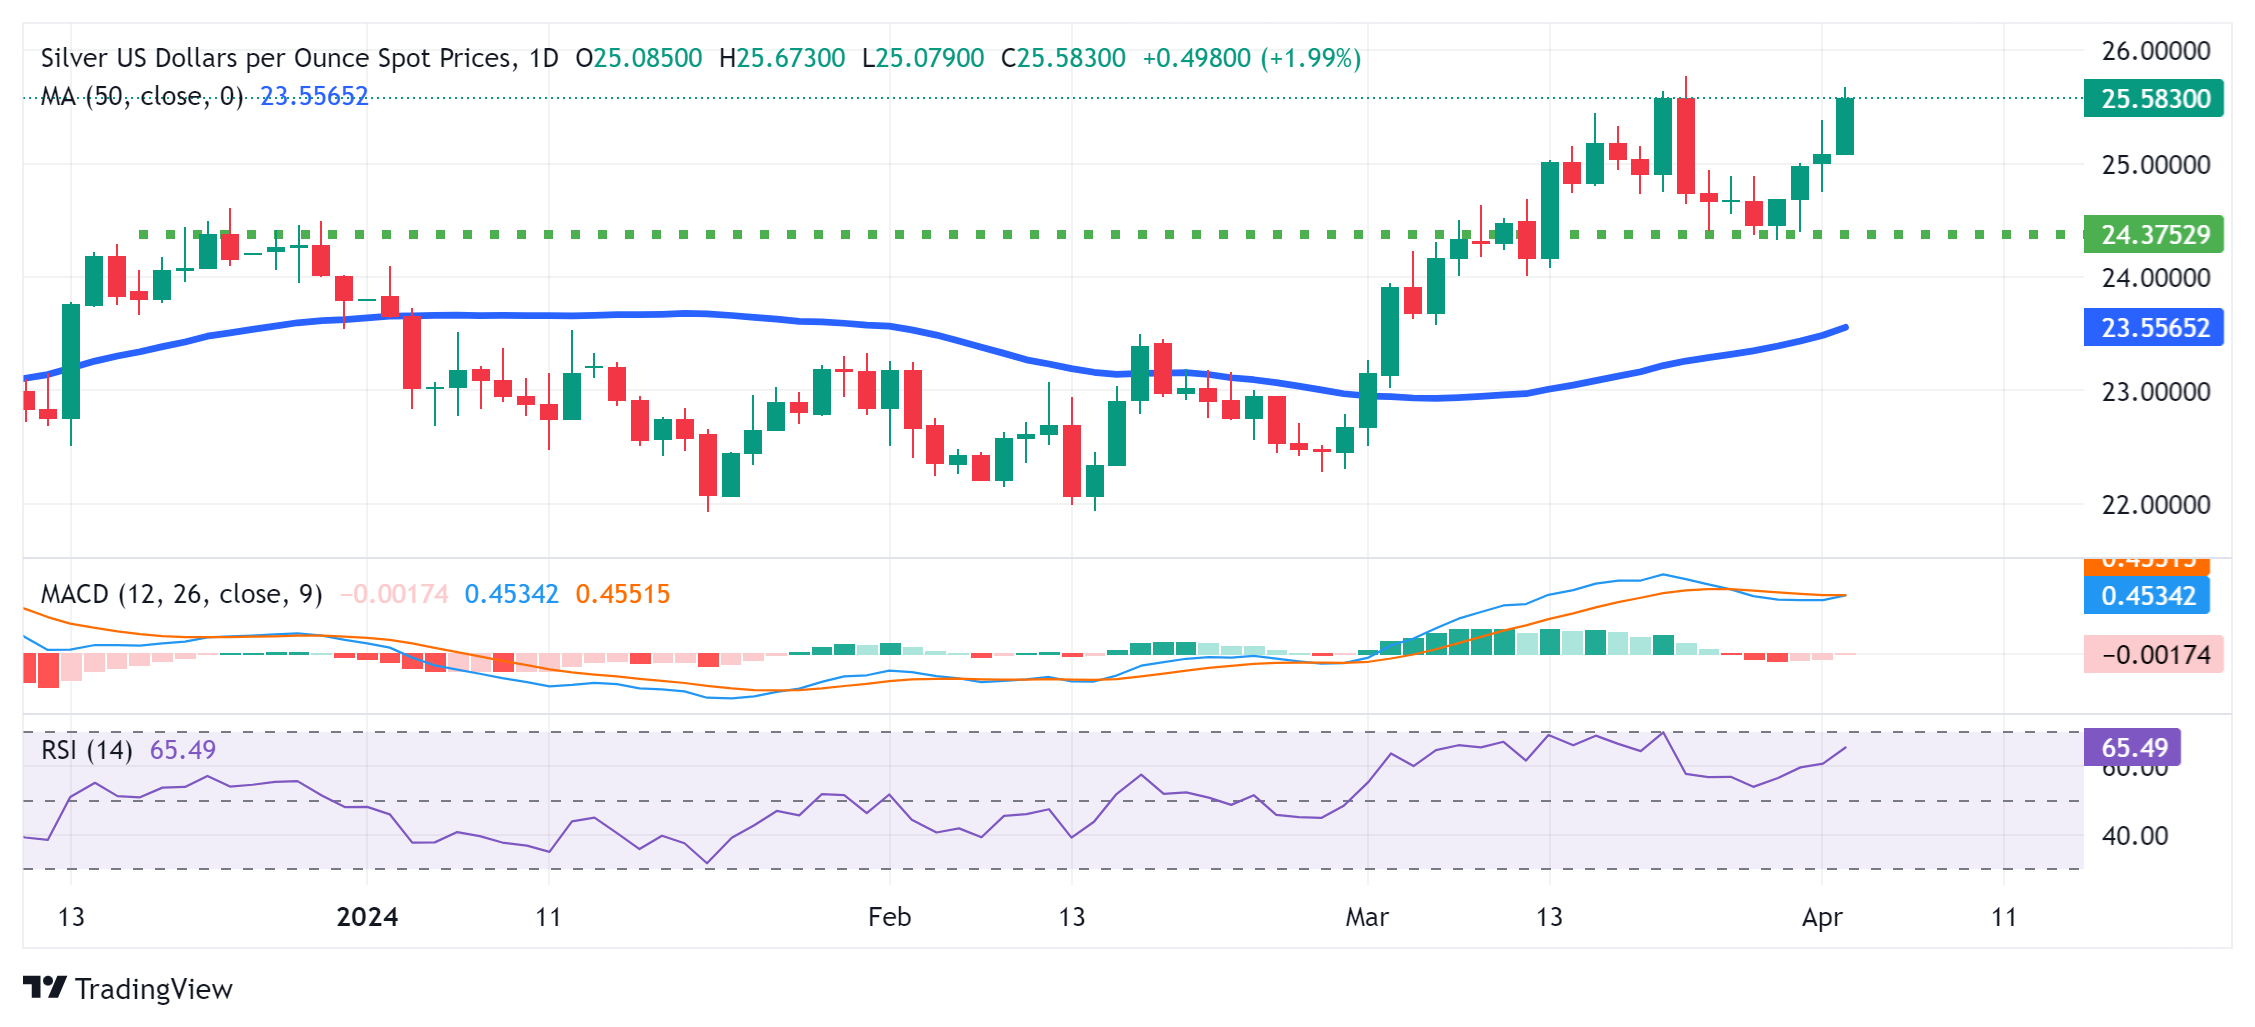
From a technical perspective, the recent bounce from the $24.35 resistance-turned-support zone and a subsequent strong move up favours bullish traders. Moreover, oscillators on the daily chart are holding in the positive territory and are still far from being in the overbought zone, suggesting that the path of least resistance for the XAG/USD is to the upside.
Hence, some follow-through strength towards testing the December 2023 swing high, just ahead of the $26.00 round figure, looks like a distinct possibility. Some follow-through buying would mark a fresh breakout and allow the XAG/USD to resume its recent strong upward trajectory witnessed since late February.
On the flip side, any meaningful corrective decline is more likely to attract fresh buyers near the $25.00 psychological mark. The next relevant support is pegged near the $24.65 region. A convincing break below the latter could drag the XAG/USD towards the aforementioned resistance-turned-support, around the $24.35 zone, which should act as a key pivotal point.
Some follow-through selling might shift the bias in favour of bearish traders and make the XAG/USD vulnerable to accelerate the decline further towards the $24.15-$24.10 region. The white metal could eventually weaken below the $24.00 round-figure mark, towards the 50-day Simple Moving Average (SMA), currently pegged near the $23.60 zone.
Silver daily chart


