


Natural Gas Price Analysis: XNG/USD prints corrective bounce near $2.30 amid bullish RSI divergence
- Natural Gas portrays corrective bounce off a five-week-old support line.
- Bullish RSI divergence adds strength to the bounce from short-term key trend line support.
- XNG/USD bears remain hopeful unless witnessing clear break of 100-SMA.
Natural Gas (XNG/USD) pares intraday gains around the lowest levels in five weeks, up 0.90% on a day near $2.28 by the press time of early Tuesday.
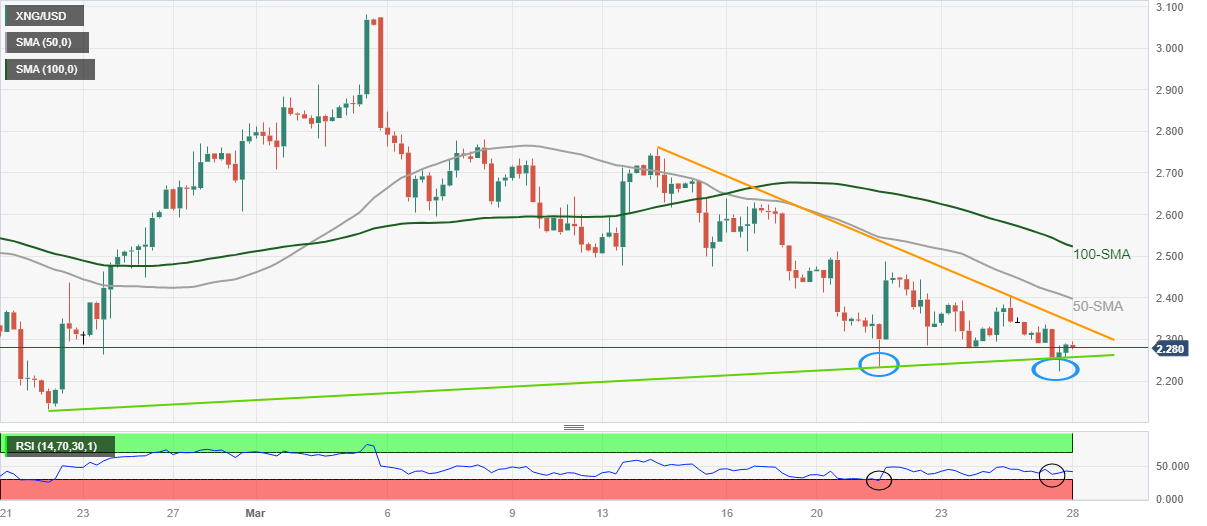
In doing so, the commodity price justifies the bullish divergence between the XNG/USD price and the Relative Strength Index (RSI) line, placed at 14, to bounce off a short-term key support line.
That said, the Natural Gas price refreshed a multi-day low the previous day but the RSI marked a higher low, which in turn portrays a bullish divergence while suggesting that the bears are running out of steam.
It’s worth noting, however, that a downward-sloping resistance line from March 14, close to $2.35 at the latest, challenges the XNG/USD rebound.
Even if the Natural Gas buyers manage to cross the $2.35 hurdle, the 50-bar Simple Moving Average (SMA) level of around $2.40 could restrict the commodity’s further advances. Above all, the 100-SMA hurdle of $2.52 acts as the last defense of the XNG/USD bears.
Meanwhile, Natural Gas sellers need a clear break of the aforementioned support line from late February, close to $2.25 by the press time, as well as witness further reduction in the RSI (14) line, to retake control.
Following that, the multi-month low marked in February around $2.13 and the $2.00 psychological magnet will gain the market’s attention.
To sum up, Natural Gas price appears to slip off the bear’s radar amid bullish RSI divergence. However, the XNG/USD buyers have a bumpy road towards the north.
XNG/USD: Four-hour chart
Trend: Bearish