


GBP/USD Price Analysis: Struggles at the 200-day EMA, plummets below 1.2000
- Unable to crack the 200-day EMA, the GBP/USD fell beneath the psychological 1.2000 figure.
- Short-term, the GBP/USD is downward biased, and once reclaiming 1.1900, it might fall to 1.1820s.
The GBP/USD moved downward on Monday, spurred by tensions arising in China due to Covid-19 zero-tolerance restrictions. US central bankers foresee a 2023 year of high-interest rates as they commit to higher for longer bolstered the US Dollar (USD). At the time of writing, the GBP/USD is trading at 1.1957, below its opening price by 0.07%, as the Asian session begins.
GBP/USD Price Analysis: Technical outlook
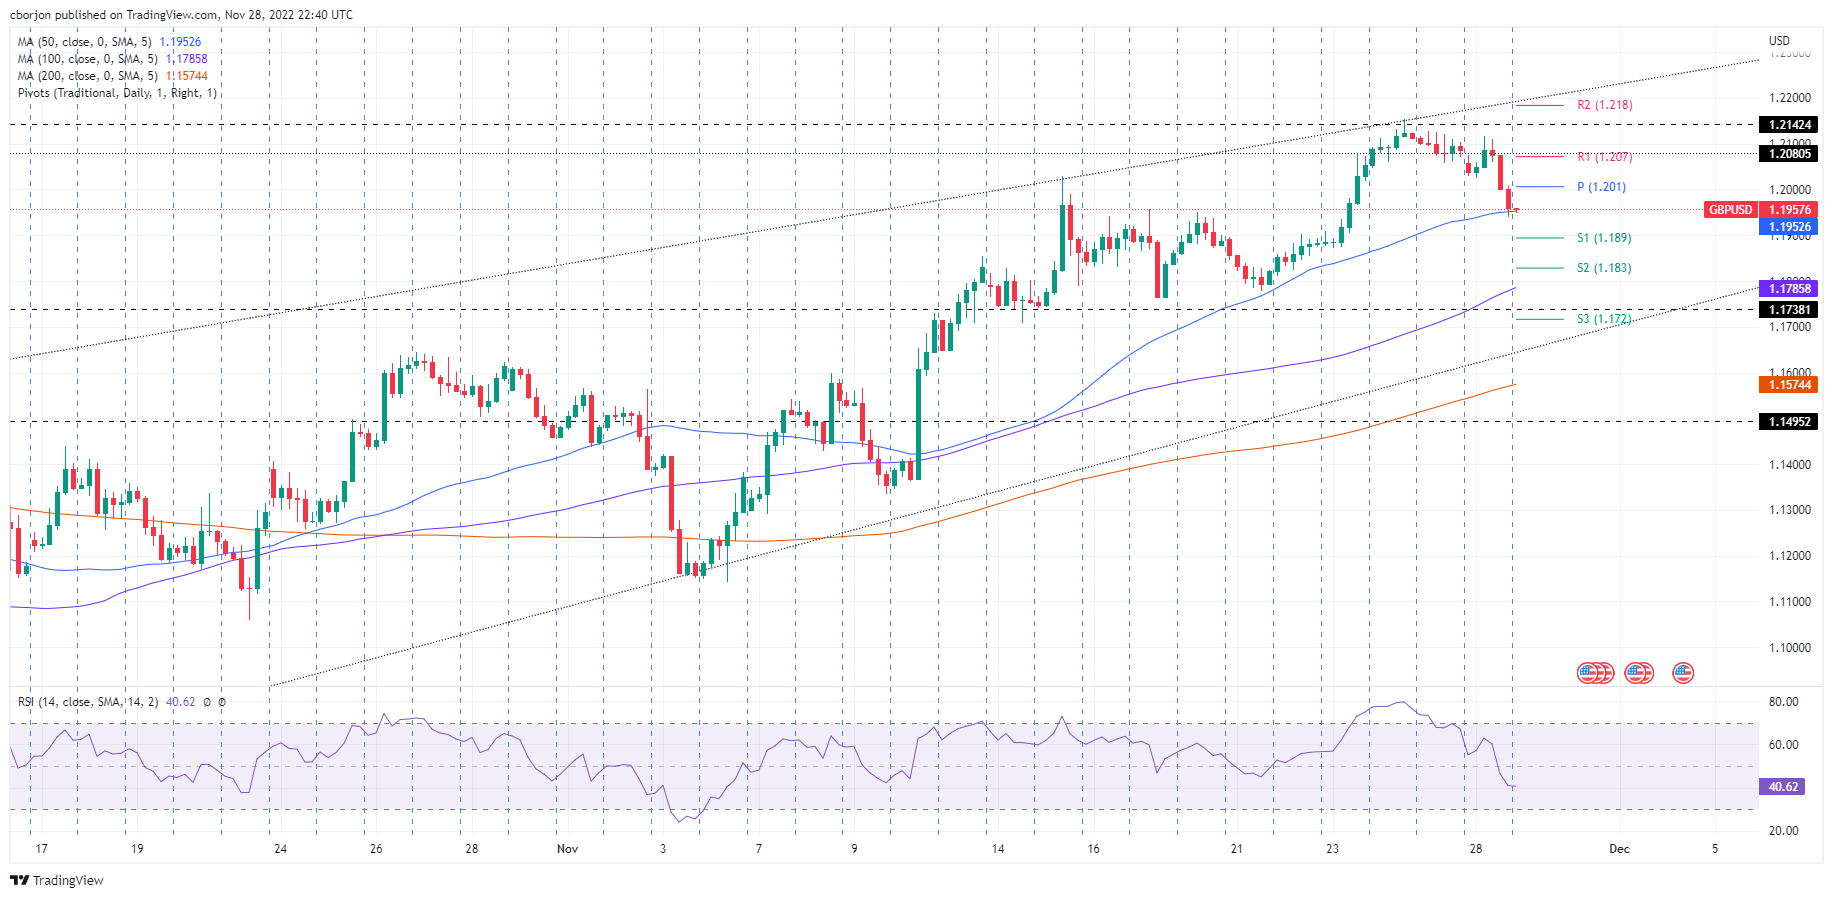
On Monday, the GBP/USD dived below the 1.2000 figure, exacerbated by Pound Sterling (GBP) buyers unable to crack the 200-day Exponential Moving Average (EMA) around 1.2170. Therefore, the GBP/USD dropped below the 1.2000 figure, eyeing a re-test of an upslope trendline drawn from September lows that pass around 1.1640/60. For that scenario to play out, the GBP/USD needs to drop below the November 23 daily low of 1.1872, which, once cleared, could pave the way for the previously mentioned upslope trendline.
Short term, the GBP/USD is testing the 50-Exponential Moving Average (EMA) in the 4-hour chart at 1.1953. The Relative Strength Index (RSI) sliding below the 50-midline suggests sellers outweigh buyers. Hence, the GBP/USD path of least resistance is downward biased.
The GBP/USD first support would be 1.1953. A decisive break will expose the 1.1900 figure, followed by the S1 daily pivot at 1.1890, ahead of the S2 daily pivot at 1.1828. On the flip side, the GBP/USD first resistance would be 1.2000, followed by the daily pivot point at 1.2010, followed by the R1 daily pivot at 1.2070.
GBP/USD Key Technical Levels