


Silver Price Analysis: XAG/USD struggles at the 200-DMA and tumbles below $21.00
- Silver price falls below the psychological $21.00 after failing to hurdle the 200-day EMA.
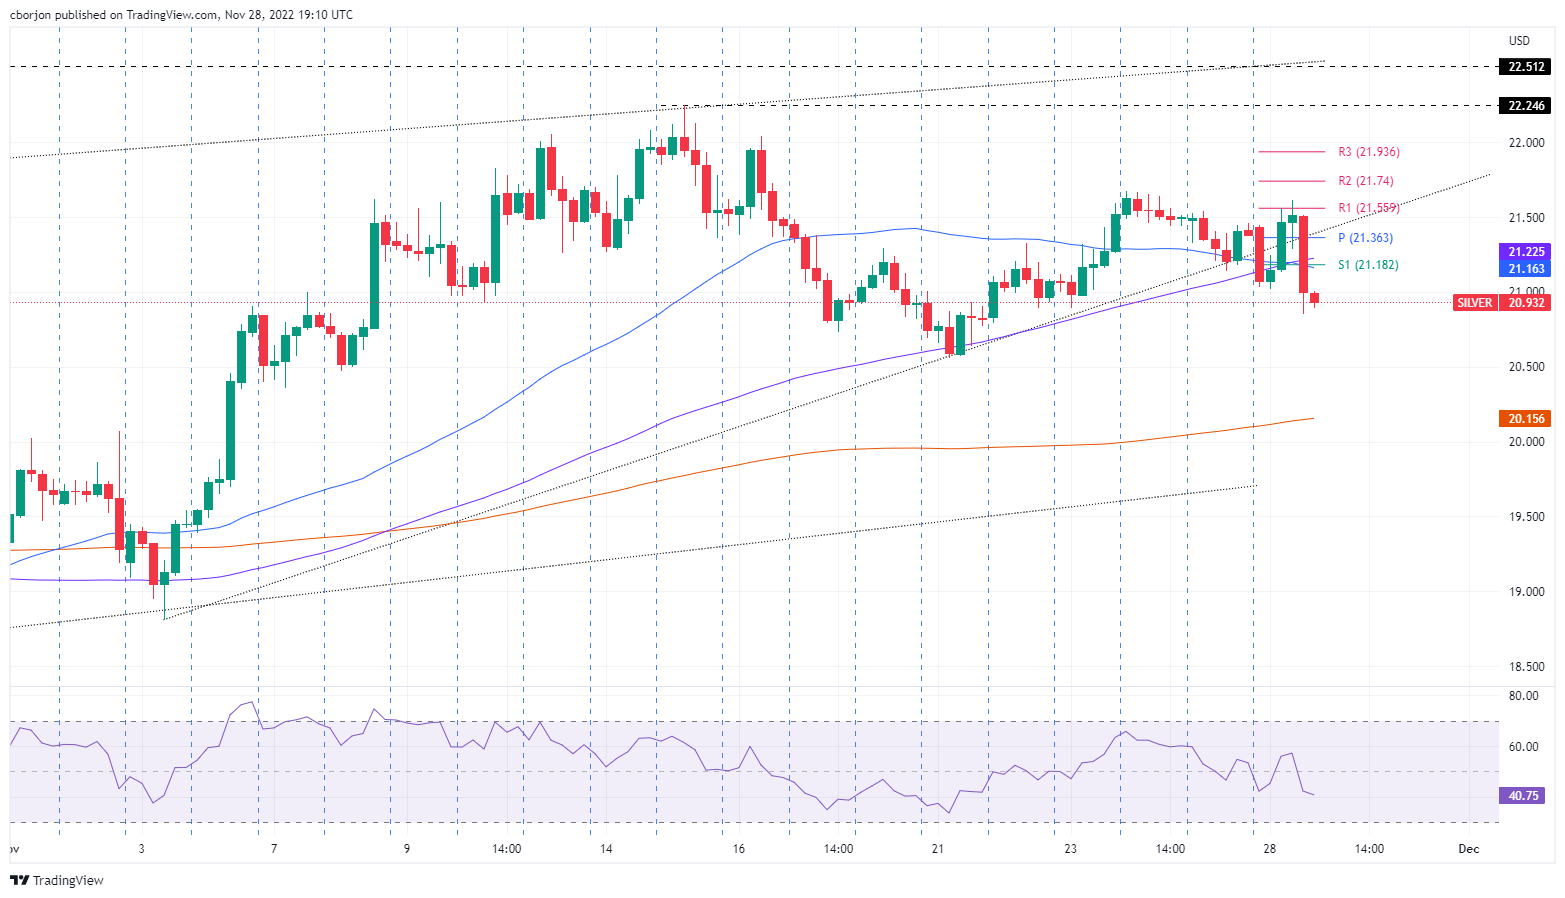
- The break of an upslope trendline exacerbated a fall from daily highs around $21.60s.
- XAG/USD Price Analysis: Break below $20.89 to pave the way to $20.00.
Silver price tumbles below $21.00 late in the North American session amidst risk aversion and the recovery of the US Dollar (USD), as shown by the US Dollar Index (DXY) gaining 0.40% in the day. At the time of writing, the XAG/USD is trading at $20.95, below its opening price by almost 2%.
Silver Price Analysis (XAG/USD): Technical outlook
After XAG/USD failed to crack the 200-day Exponential Moving Average (EMA) at $21.34, the white metal is extending its losses below the $21.00 figure. It should be noted that Silver broke below a 20-day-old upslope trendline, exacerbating Silver’s drop. The Relative Strength Index (RSI), aiming towards the 50-midline, is accelerating, suggesting that sellers are gathering momentum.
Short term, the XAG/USD 4-hour chart portrays sellers’ strength. Notably, XAG/USD hit a daily high of around $21.61 before tumbling and reclaiming the 50 and 100-EMAs. Therefore, the XAG/USD path of least resistance is tilted to the downside. That said, the XAG/USD first support would be November 23, swing low at $20.89. Once cleared, the next support would be the November 21 pivot low at $20.56, followed by the 200-Exponential Moving Average (EMA) at $20.15.
As an alternate scenario, XAG/USD first resistance would be the confluence of the S1 pivot and the 40-EMA at $21.16, followed by the daily pivot point at $21.36, ahead of the R1 pivot at $21.55.
Silver Key Technical Levels