


GBP/JPY Price Analysis: Outlook turns positive, supported by a bullish engulfing pattern
- GBP/JPY rises and trades above the 20 and 50-day EMAs, reflecting a gain of 1.18%.
- The pair formed a bullish engulfing candle pattern, with oscillators favoring the upside in the daily chart.
- GBP/JPY Price Analysis: In the short term might test 160.00 unless buyers reclaim 162.00.
GBP/JPY pops after three days of losses, and trades above the 20 and 50-day Exponential Moving Averages (EMAs), sitting at 161.54 and 161.59, respectively. After hitting a daily low of 159.56, the GBP/JPY is trading at 161.68, gaining 1.18%.
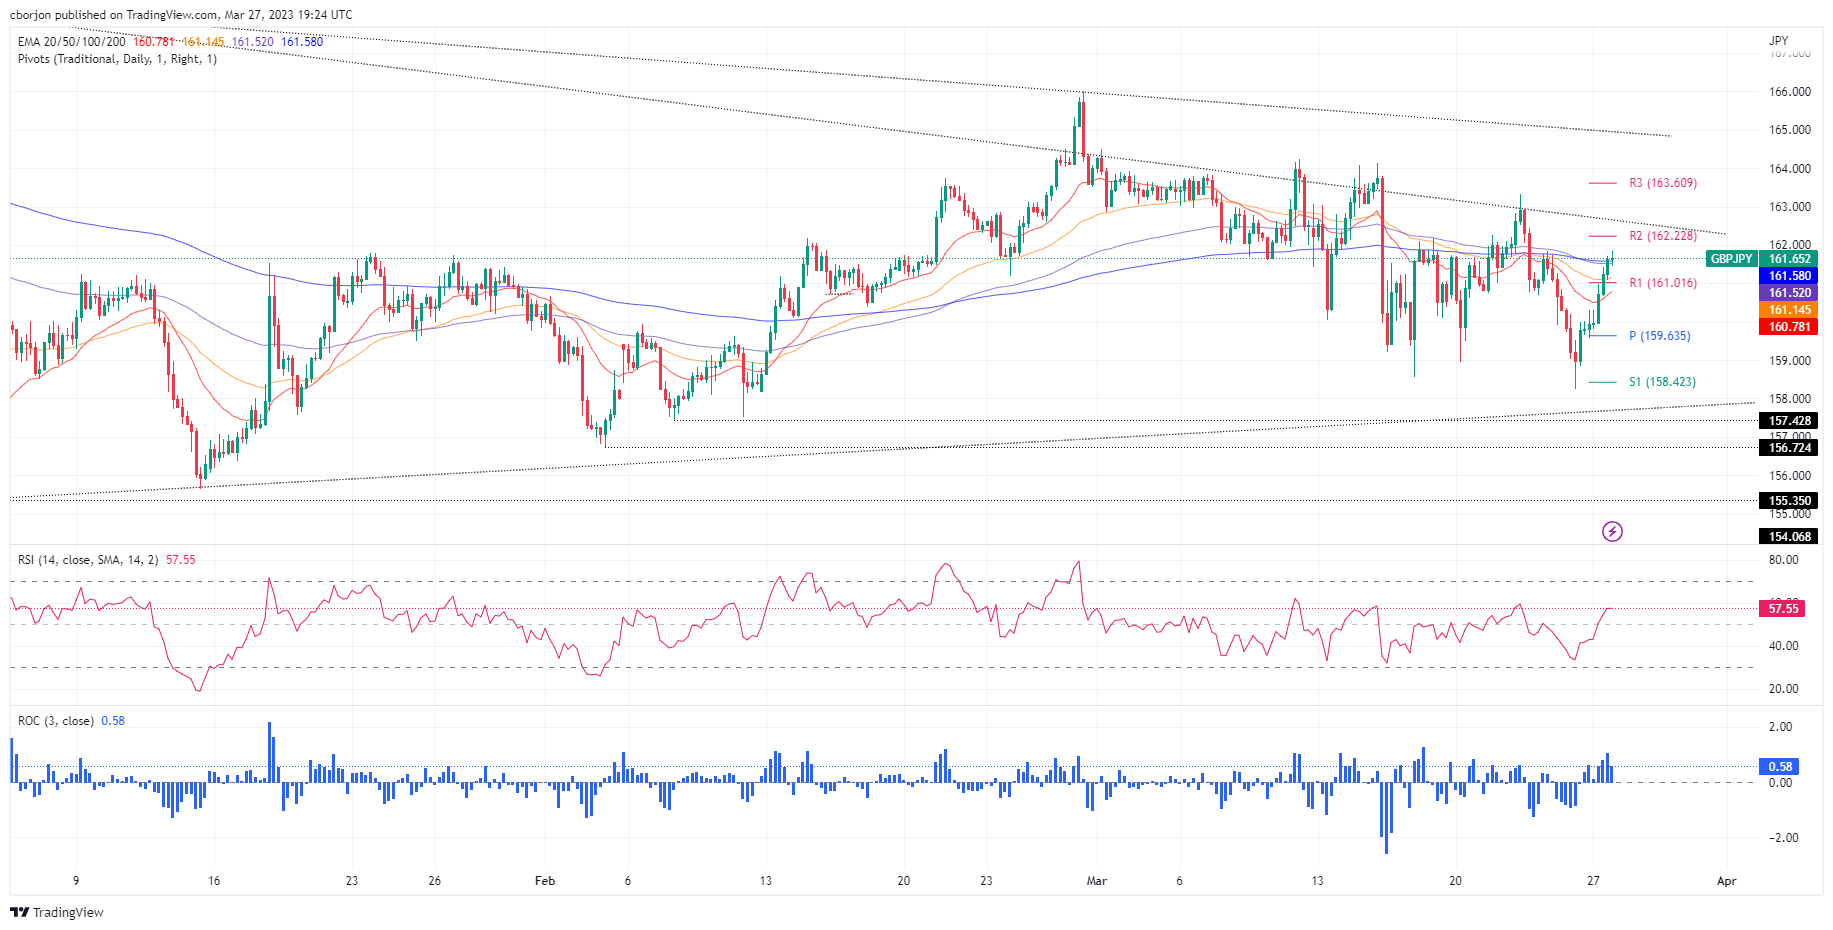
GBP/JPY Price Analysis
Friday’s price action portrayed a hammer preceded by a downtrend, meaning that the GBP/JPY might print a leg-up. On Monday, the GBP/JPY resumed its uptrend, forming a bullish engulfing candle pattern, favoring the upside in the cross-currency pair. The Relative Strength Index (RSI) also shifted bullish, while the Rate of Change (RoC) jumped from neutral.
From an intraday perspective, the GBP/JPY 4-hour chart portrays the pair as neutral to downward biased facing the confluence of the 100 and 200-EMAs, around 161.52/58. A decisive break and the GBP/JPY could rally to 162.00, followed by the R2 daily pivot point at 162.22. Upside risks lie at a 5-month-old downslope trendline at around 162.50-60, followed by a March 23 daily high test at 163.33.
On the other hand, and the GBP/JPY path of least resistance in the near term, the first support would be the 50-EMA at 161.14, immediately followed by the R1 daily pivot at 161.01. Once hurdle, the pair might fall to the 20-EMA at 160.78, followed by a dip to the central pivot at 159.63.
GBP/JPY 4-Hour chart
GBP/JPY Technical levels