


Gold Price Forecast: XAU/USD tracks sideways as banking crisis fears subside
- Gold price ranges in the $1,950s as contagion concern subsides.
- Market buoyed by comments from Michael Barr that Fed will use all tools to support any institution no matter the size.
- US Treasury bond yields rise as traders price out risk of deeper crisis and start betting on hikes again.
Gold price flatlines in the $1,950s during the early European Session on Tuesday, suppressed by a confluence of overhead technical resistance at $1,960. The surge to over $2,000 last week on panic-buying as the banking crisis worsened seems to have been as short-lived as a distress flare from a castaway.
The market mood took a turn for the better at the start of the week on more failing-bank-takeover news, and as United States policymakers assured lawmakers that they have the “tools” necessary to stop any further banking sector contagion from spreading.
A Barr to further contagion
On Monday, markets took comfort and rallied from the news First Citizens Bank had bought up the assets of defunct lender Silicon Valley Bank (SVB) in a copycat deal of UBS’s adoption of flailing (No) Credit Suisse.
Investors were further reassured by the early publication of Federal Reserve (Fed) Vice Chair for Supervision Michael Barr’s testimony to the Senate Banking Committee, which is scheduled for hearings about the banking crisis on Tuesday and Wednesday. Barr’s language was unequivocal, stating, “We will continue to closely monitor conditions in the banking system and are prepared to use all of our tools for any size institution, as needed, to keep the system safe and sound.”
The terminal rate debate
US Treasury bond yields impact Gold price as they reflect interest rate expectations and the opportunity cost of holding the bright metal, which is a non-yielding asset unlike cash deposits or bonds.
Yields rose on Monday as traders took heart from the positive news about the banking crisis being in the rear view mirror and began pricing in the possibility that the US Federal Reserve would continue cranking up interest rates in their fight with inflation.
The yield on the benchmark 10-year US Treasury bond rose a stonking 4.65% to 3.53% in one day as market expectations flipped back to expecting the return of an aggressive Fed.
Another barometer of the Fed’s future course of policy, however, the Fed Fund Futures Curve, is stating the opposite, indicating the probabilities continue to support the Fed pausing at their next meeting in May – and even a chance of three 0.25% rate cuts before the end of the year, suggesting rates may have already reached their terminal peak.
The divergence may explain Gold’s current lack of direction, and the fog needs to lift on the real state of the financial system before investors can start to get a real handle on the Fed’s future plans.
Uptrend still intact as long as Gold holds above $1,934
Despite the recent rollover from the plus-$2,000 highs, Gold price remains in an uptrend when looked at on a medium-term basis. Overall it continues to make higher highs and lows on the daily chart. This, according to the old adage, “The trend is your friend until the bend at the end,” still broadly favors bullish bets.
-638155856824653199.png)
Gold price: Daily Chart
Yet within its uptrend Gold price appears to be range bound just now. The range’s high is at the $2,009 March top and a low at the $1,934 March 22 swing low. It would require a break above the former or below the latter to confirm the next directional move for Gold.
A break and close above $2,009 would confirm a continuation higher (the base case). The next target for Gold price then lies at the $2,070 March 2022 highs.
A break below $1,934 would introduce doubt into the overall bullish assessment of the trend and probably see a sharp decline to support at $1,990 supplied by the 50-day Simple Moving Average (SMA).
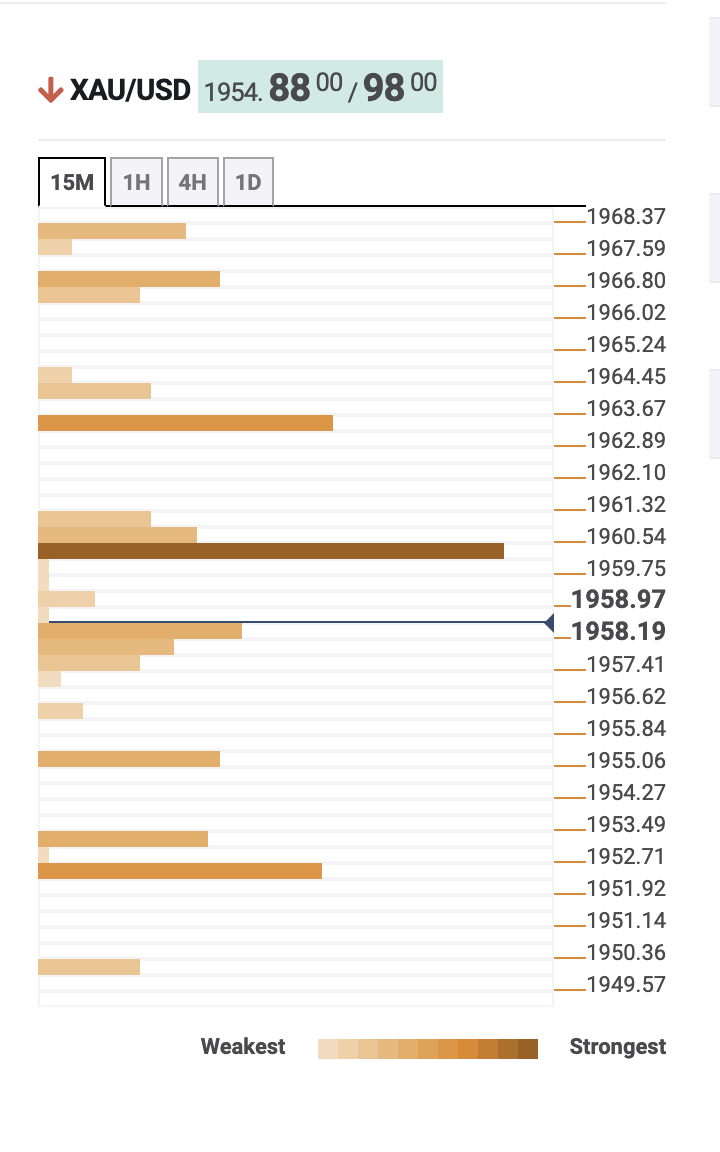
Looking even closer, the Technical Confluence Indicator (below) is showing a thicket of resistance at $1,960, just above where price has been churning overnight. This tough crack will need to be broken to see Gold even attempt to return to its crisis highs.
The Relative Strength Index (RSI) momentum indicator on the daily chart, is losing pace with price dipping comparably lower and showing a touch of underlying weakness, though the divergence is not dramatic enough to draw any conclusions from.