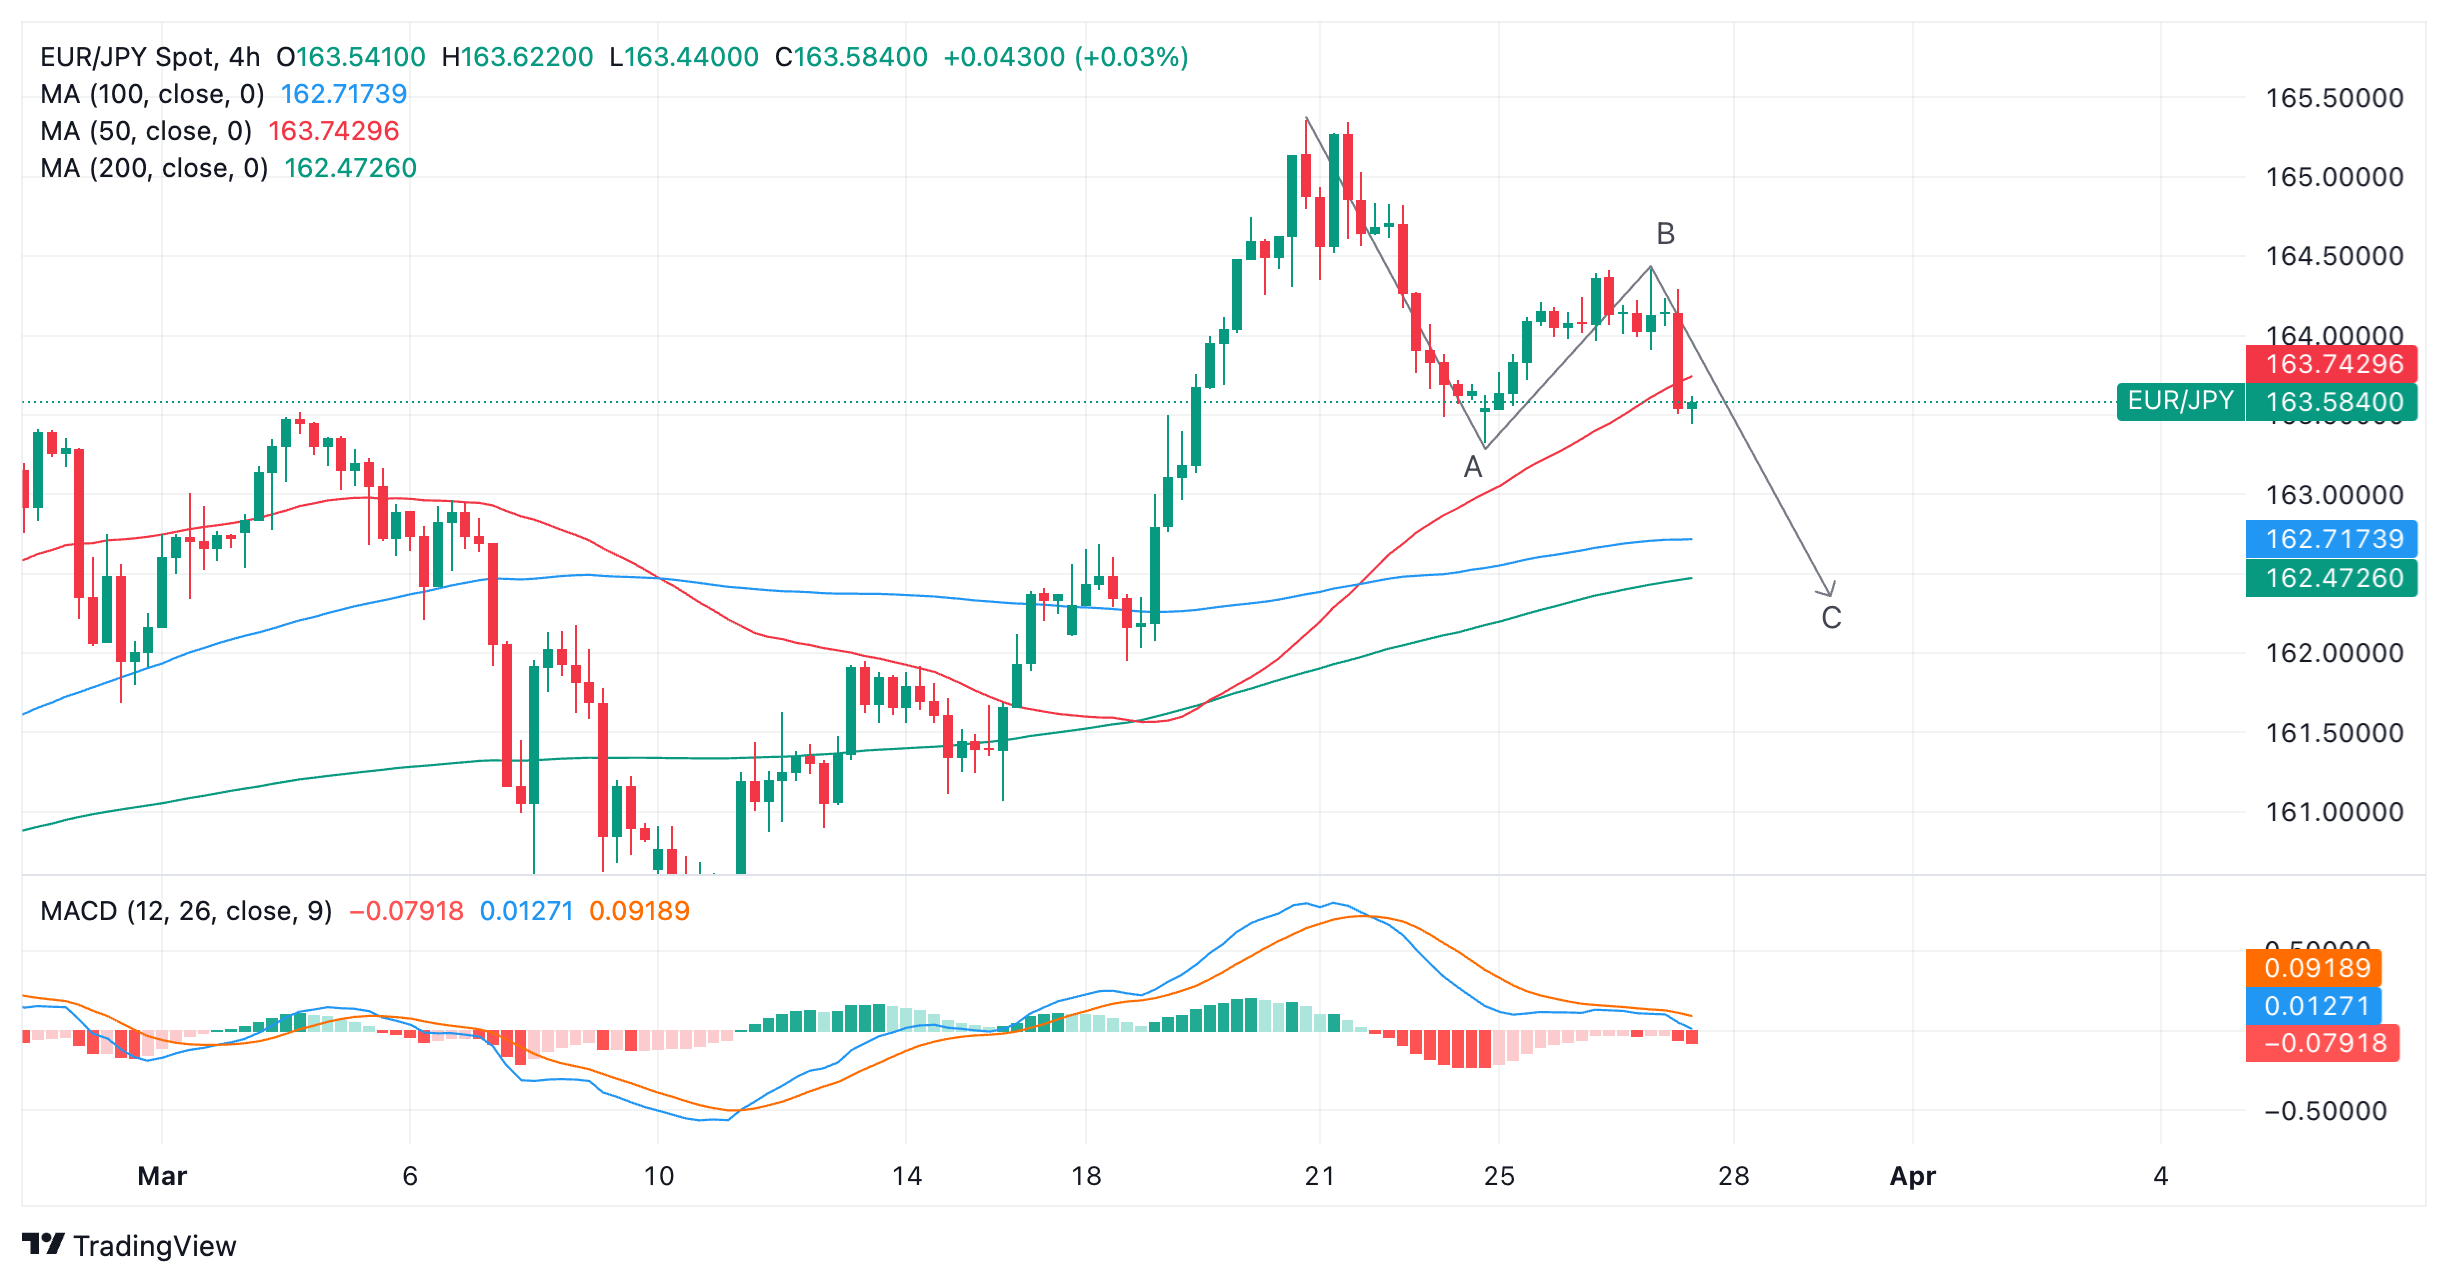
EUR/JPY Price Analysis: Wave C of a bearish Measured Move unfolds
- EUR/JPY continues declining and has formed a bearish pattern called a Measured Move.
- It is composed of three waves – wave C appears to be in mid development.
- The bearish 4-hour chart echoes weak technicals observed on the weekly chart.
EUR/JPY is down over a third of a percent, trading in the 163.70s on Wednesday, on the back of a mixture of probable intervention by the Japanese authorities to strengthen the Japanese Yen (JPY) and more dovish commentary from rate-setters at the European Central Bank (ECB).
The 4-hour chart is showing a bearish ABC Measured Move pattern forming which looks like it probably still has lower to go.
Euro versus Japanese Yen: 4-hour chart
If wave C is the same length as wave A, which is often the case, the Measured Move could stretch down to a target situated at about 162.40, just below the 200-4hr Simple Moving Average (SMA).
The pair has just completed a long red bearish Marubozu Japanese candlestick pattern which adds a further bearish tone to the chart. Even if there is a pullback after the sell-off it will probably only go as high as the midpoint of the Marubozu candle at 163.90 before probably continuing lower.
The short-term trend remains unclear but a break below the lows of wave A at 163.32 would provide confirmation shifting the odds in favor of a downtrend and a continuation of wave C.
The acute bearish divergence with the Relative Strength Indicator (RSI) on the Weekly chart as reported in a previous article, is further evidence supporting more downside.


