EUR/USD Price Analysis: Hovers below the psychological resistance of 1.0900
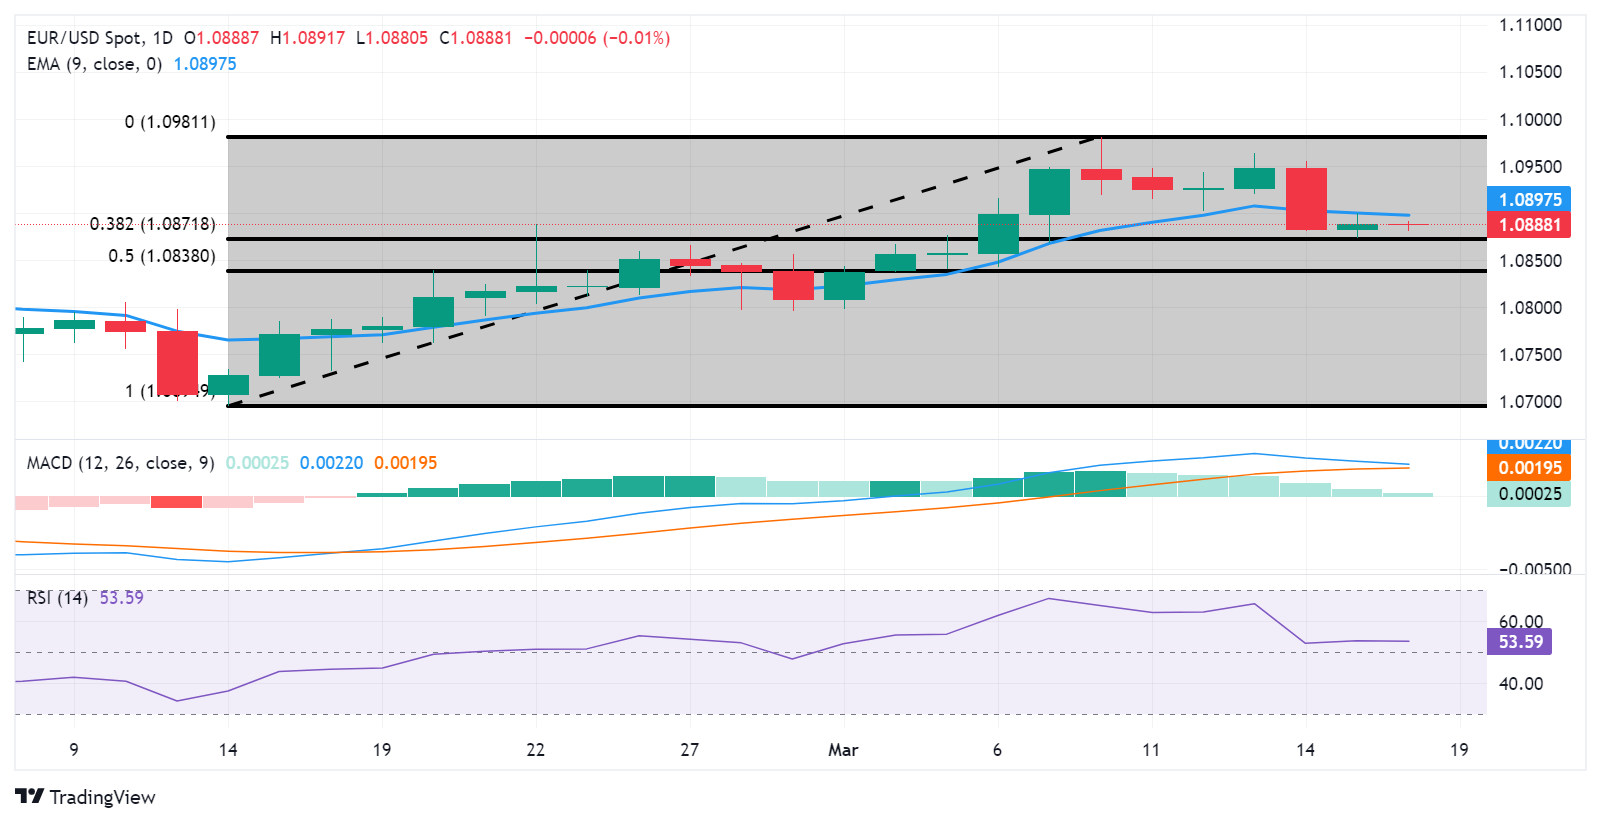
- EUR/USD may encounter immediate support around the 38.2% Fibonacci retracement level of 1.0871.
- Technical analysis indicates a potential confirmation of bullish momentum for the pair.
- The immediate resistance area is expected near the nine-day EMA at 1.0897 and the psychological level of 1.0900.
EUR/USD edges lower to near 1.0890 during the Asian market hours on Monday. The pair receives downward pressure as the market adopts caution ahead of the Federal Reserve’s (Fed) interest rate decision.
The EUR/USD pair could meet the immediate support at 38.2% Fibonacci retracement level of 1.0871, followed by the major support of 1.0850. A break below this level could push the pair to test the further 50.0% retracement level of 1.0838. Further support should have appeared at the psychological level of 1.0800.
Technical analysis suggests a bullish sentiment for the EUR/USD pair. The 14-day Relative Strength Index (RSI) is positioned above the 50 mark, indicating strength in buying momentum. Additionally, the Moving Average Convergence Divergence (MACD) shows a divergence above the signal line and remains above the centerline. Although a lagging indicator, this alignment indicates a confirmation of the bullish momentum for the EUR/USD pair.
On the upside, the immediate resistance appears at the nine-day Exponential Moving Average (EMA) at 1.0897, aligned with the psychological level of 1.0900. A break above the latter could lead the EUR/USD pair to navigate the major barrier at 1.0950, followed by the previous week’s high at 1.0963.
EUR/USD: Daily Chart


