


AUD/JPY Price Forecast: Tests nine-day EMA barrier, near 96.00 psychological level
- AUD/JPY may find primary support at the 50-day EMA of 95.07.
- The 14-day Relative Strength Index is positioned on the 50 mark, indicating a neutral bias.
- The immediate resistance appears at the nine-day EMA of 95.98.
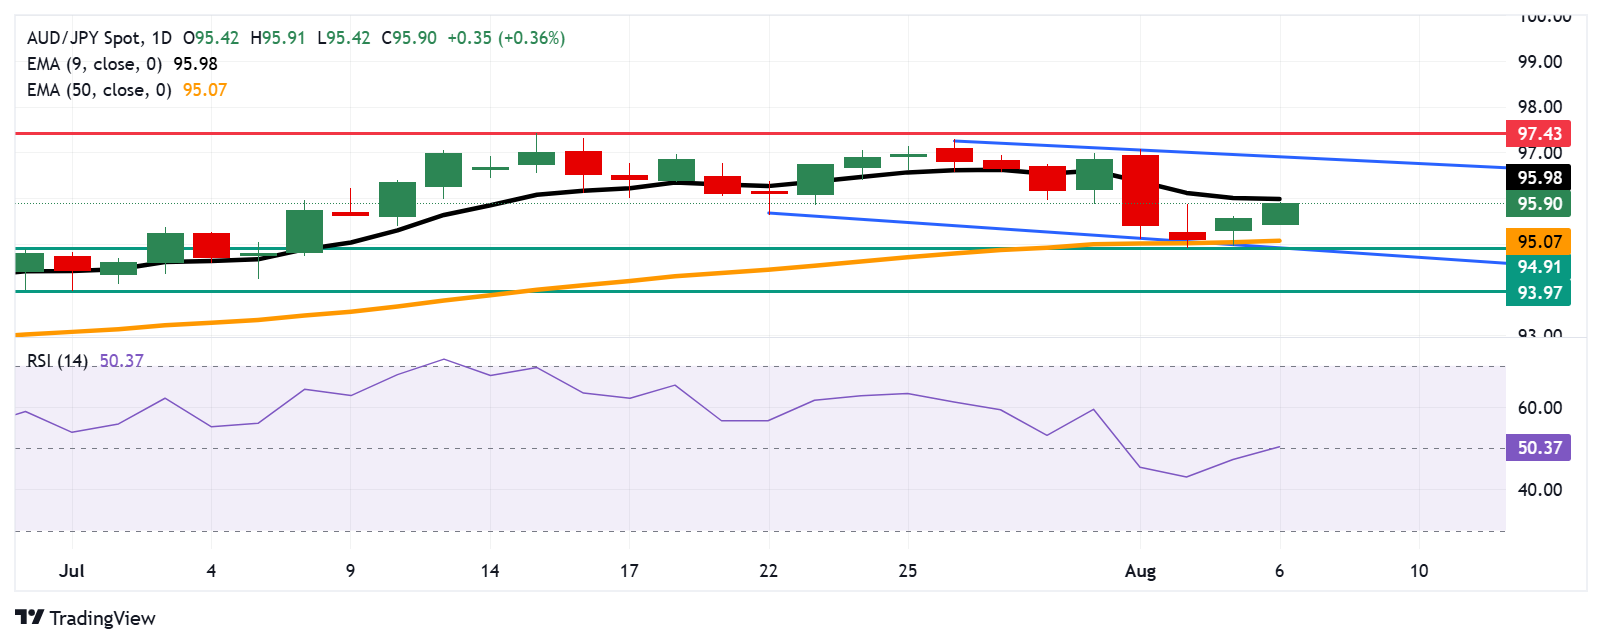
AUD/JPY continues to gain ground for the second successive day, trading around 95.90 during the European hours on Wednesday. The technical analysis of the daily chart shows that the currency cross remains within the descending channel pattern, suggesting a prevailing bearish bias.
Additionally, the AUD/JPY cross remains below the nine-day Exponential Moving Average (EMA), indicating short-term price momentum is weaker. However, the 14-day Relative Strength Index (RSI) is positioned on the 50 mark, indicating a neutral market sentiment. Further movements will offer a clear directional trend.
The AUD/JPY cross may find initial support at the 50-day EMA of 95.07, followed by the monthly low at 94.91, which is aligned with the lower boundary of the descending channel. A successful break below this crucial support zone would strengthen the bearish bias and put downward pressure on the currency cross to navigate the region around the two-month low at 93.97, which was recorded on July 1.
On the upside, the AUD/JPY cross tests the nine-day EMA at 95.98, aligned with the psychological level of 96.00. A break above this level would improve the short-term price momentum and support the pair to approach the descending channel’s upper boundary around 96.90. Further advances would cause the emergence of the bullish bias and prompt the currency cross to target the seven-month high at 97.43, which was recorded on July 15.
AUD/JPY: Daily Chart
Australian Dollar PRICE Today
The table below shows the percentage change of Australian Dollar (AUD) against listed major currencies today. Australian Dollar was the strongest against the Japanese Yen.
| USD | EUR | GBP | JPY | CAD | AUD | NZD | CHF | |
|---|---|---|---|---|---|---|---|---|
| USD | -0.00% | 0.12% | 0.16% | -0.03% | -0.38% | -0.21% | 0.12% | |
| EUR | 0.00% | 0.10% | 0.17% | -0.03% | -0.28% | -0.25% | 0.12% | |
| GBP | -0.12% | -0.10% | 0.06% | -0.13% | -0.40% | -0.38% | 0.07% | |
| JPY | -0.16% | -0.17% | -0.06% | -0.20% | -0.57% | -0.48% | 0.02% | |
| CAD | 0.03% | 0.03% | 0.13% | 0.20% | -0.25% | -0.24% | 0.20% | |
| AUD | 0.38% | 0.28% | 0.40% | 0.57% | 0.25% | 0.03% | 0.46% | |
| NZD | 0.21% | 0.25% | 0.38% | 0.48% | 0.24% | -0.03% | 0.44% | |
| CHF | -0.12% | -0.12% | -0.07% | -0.02% | -0.20% | -0.46% | -0.44% |
The heat map shows percentage changes of major currencies against each other. The base currency is picked from the left column, while the quote currency is picked from the top row. For example, if you pick the Australian Dollar from the left column and move along the horizontal line to the US Dollar, the percentage change displayed in the box will represent AUD (base)/USD (quote).