


USDJPY Price Analysis: Falls below 131.00 on sour market sentiment
- USD/JPY gives up some of Monday’s gains as investors brace for safety.
- The USD/JPY needs to tumble below 130.49 for a bearish continuation.
- Conversely, a bullish scenario is likely if the USD/JPY climbs toward 131.76.
USD/JPY pares some of Monday’s gains and drops below the 131.00 figure after Wall Street closed with losses. At the time of writing, the USD/JPY is trading at 130.91, registering minuscule gains as the Asian session begins.
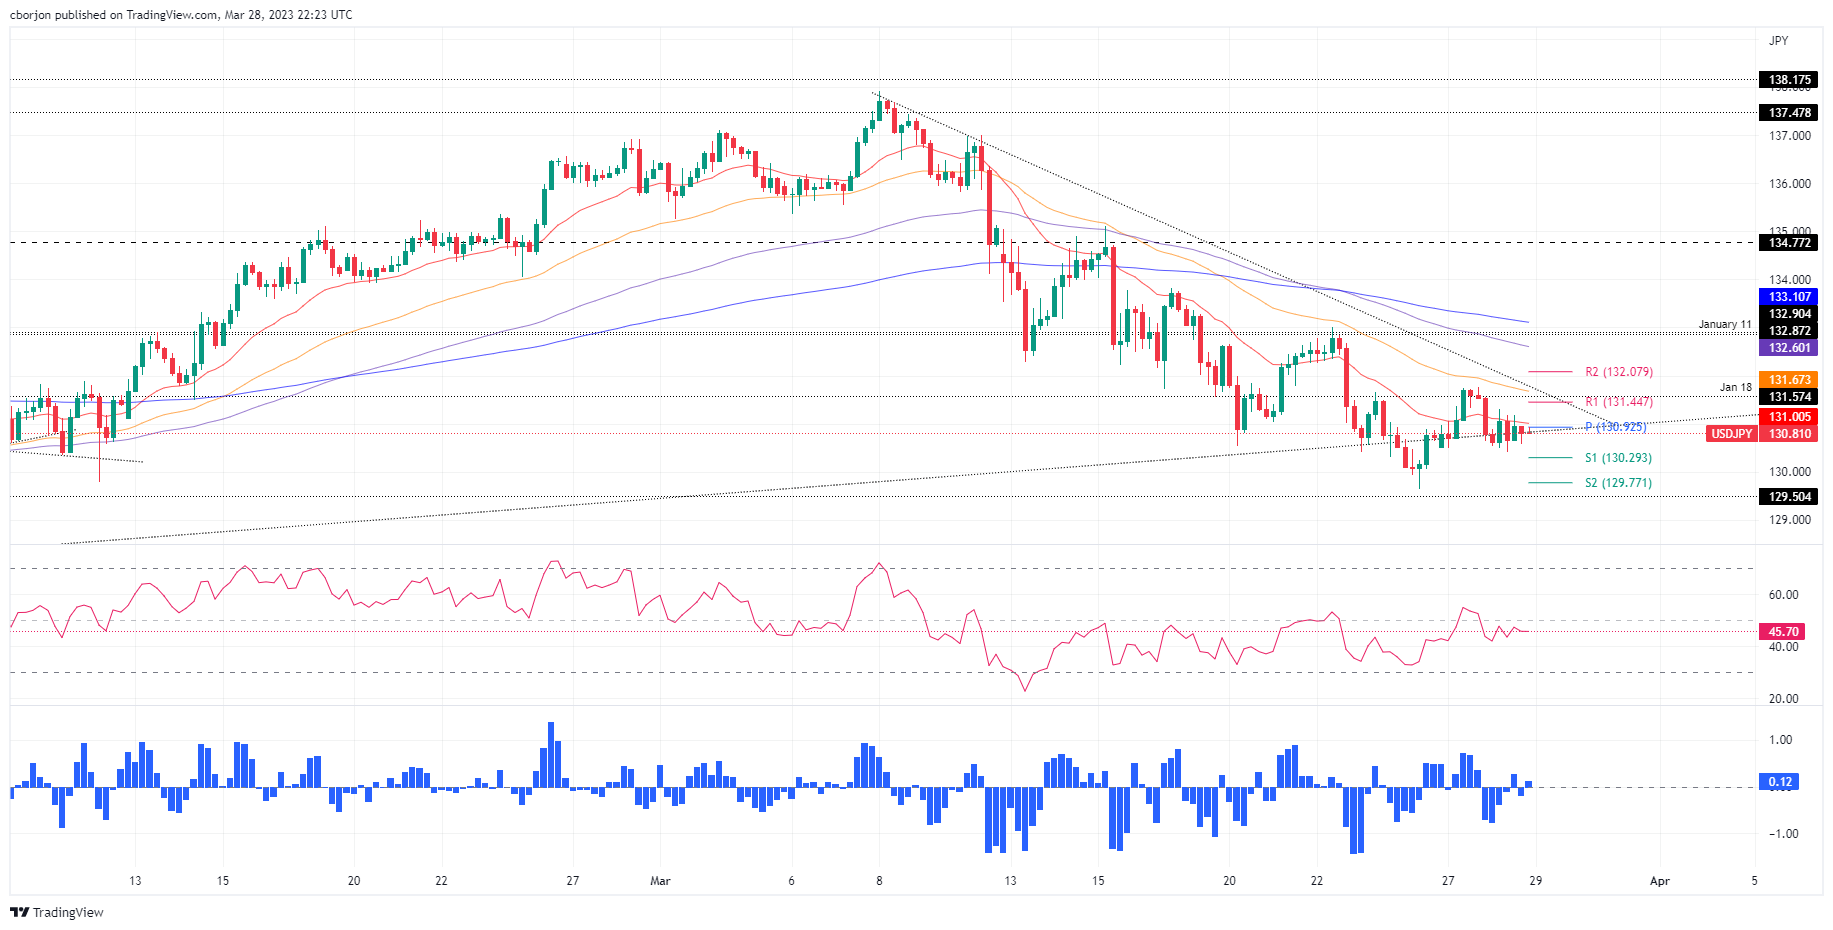
USD/JPY Price action
The USD/JPY is neutral to downward biased, and Tuesday’s close below 131.00 could exacerbate a fall toward the last week’s lows of 129.64. For a bearish continuation, the USD/JPY needs to tumble below 130.49, which could open the door toward 130.00, ahead of 129.64. Contrarily, a bullish scenario is likely if the USD/JPY climbs toward 131.76. Hence. The USD/JPY first resistance would be 132.00, followed by 133.00. Once cleared, the 50-day EMA would be tested at 133.27, followed by the 200-day EMA at 133.81.
Short term, the USD/JPY 4-hour chart is consolidating after Tuesday’s low of 130.40. additionally, the Relative Strength Index (RSI) shifted flat, in bearish territory, while the Rate of Change (RoC) is almost unchanged. Therefore, the USD/JPY might continue to be range-bound before resuming upwards/downwards.
If the USD/JPY breaks above the 20-EMA at 131.00, that will open the door for further upside. The next resistance would be the R1 daily pivot point at 131.44, followed by the 50-EMA at 131.67, ahead of challenging 132.00. On the other hand, the USD/JPY first support would be the S1 daily pivot at 130.29, followed by 130.00, ahead of testing the YTD low at 129.64.
USD/JPY 4-hour chart
USD/JPY Technical levels