


Gold Price Forecast: XAU/USD poised to move sideways in between key MAs
- Gold staged a modest rebound after dropping to $1,805.
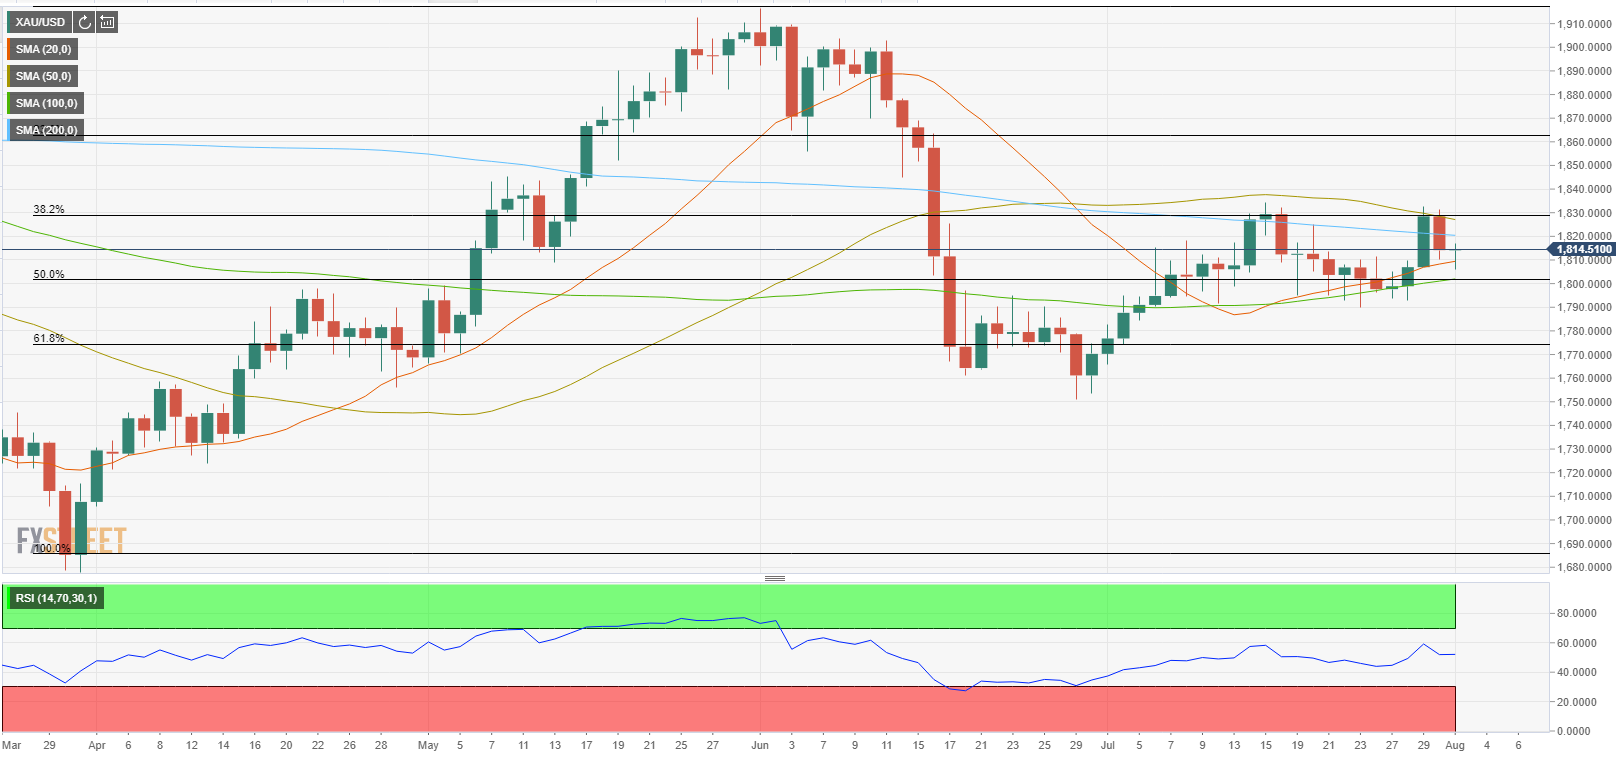
- 200-day SMA aligns as strong resistance at $1,820.
- Sellers could have a difficult time dragging gold below $1,800.
Following Friday's sharp decline, the XAU/USD pair started the new week on the back foot and declined to a daily low of $1,805. However, gold managed to pare its daily losses in the early American session and was last seen trading flat on the day at $1,815.
In the absence of significant macroeconomic data releases, gold struggled to find demand in the risk-positive market environment. Reflecting the upbeat market mood, Wall Street's main indexes opened in the positive territory and major European equity indices remain on track to register daily gains.
On the other hand, the US Dollar Index is fluctuating in a tight range around 92.00 at the start of the week, not allowing XAU/USD to make a decisive move in either direction.
Earlier in the day, the data from the US revealed that the business activity in the manufacturing sector continued to expand at a robust pace in July. The IHS Markit revised the Manufacturing PMI higher to 63.4 from 63.1 in the flash estimate and the ISM's Manufacturing PMI arrived at 59.5. Although this reading came in lower than the market expectation of 60.9, it was largely ignored by market participants. In the meantime, the Prices Paid component of the ISM's survey retreated to 85.7 from the all-time high it set at 92.1 in July and made it difficult for the greenback to gather strength.
There won't be any other macroeconomic data releases from the US in the remainder of the day and XAU/USD is likely to continue to fluctuate in its daily range.
Gold technical outlook
With this recent price action, gold's near-term technical outlook remains neutral. Confirming the pair's indecisiveness, the Relative Strength Index (RSI) indicator on the daily chart is flat near 50.
The initial resistance is located at $1,820 (200-day SMA) and a daily close above that level could open the door for additional gains toward $1,830 (50-day SMA) and $1,845 (static level).
Supports, on the other hand, could be seen at $1,810 (20-day SMA) and $1,800 (100-day SMA, psychological level, Fibonacci 50% retracement of the April-June uptrend) and $1,790 (July 23 low). The latter is a significant level and a break below that support could attract additional sellers and cause the technical outlook to turn bearish.
Additional levels to watch for