


WTI Price Analysis: Extends bounce off 200-HMA towards $86.00 hurdle
- WTI begins the Fed week on a positive note, extends Friday’s rebound from weekly low.
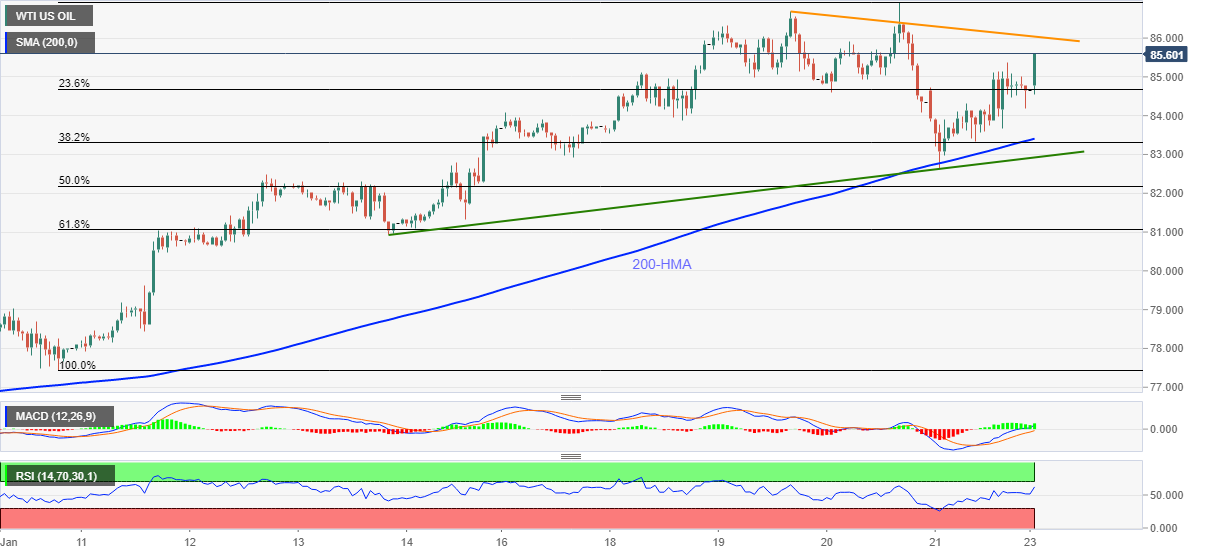
- Three-day-old resistance line holds the key to further upside.
- Bullish MACD signals, firmer RSI line keep buyers hopeful.
- Seven-day-long support line adds to the downside filters.
WTI takes the bids to refresh intraday high near $85.50, up 1.0% daily, during early Asian morning on Monday.
In doing so, the black gold extends the previous day’s recovery moves from the 200-HMA amid firmer RSI and MACD signals.
However, oil bulls need validation from a downward sloping resistance line from Thursday, near $86.00. Also acting as an upside filter is the recently flashed multi-month top near $86.93.
During the quote’s run-up beyond $86.93, the $87.00 threshold and the $90.00 psychological magnet may act as buffers before direct WTI crude oil buyers towards September 2014 high near $95.00.
Alternatively, pullback moves may retest the 200-HMA level of $83.40 whereas any further downside will be challenged by a short-term ascending trend line near $82.90.
If at all the WTI crude oil prices drop below $82.90, the 61.8% Fibonacci retracement of January 10-20 upside, around $81.00, will be crucial for traders to watch before welcoming sellers.
WTI: Hourly chart
Trend: Further upside expected