Gold Price Forecast: XAU/USD oscillates around $1,960 amid mixed responses to Fed’s June policy
- Gold price is juggling in a narrow range as the investing community is divided about June’s monetary policy.
- US banks seem reluctant in distributing credit to households and firms in order to maintain their asset quality.
- Gold price is consolidating around the 50% Fibonacci retracement at $1,960.00.
Gold price (XAU/USD) is auctioning inside the woods around $1,960.00 in the early London session. The precious metal is displaying back-and-forth action as the investing community is divided about the interest rate decision by the Federal Reserve (Fed) to be taken in June’s monetary policy meeting.
S&P500 futures have surrendered nominal gains added in Asia, portraying a decline in the risk appetite of the market participants. The US Dollar Index (DXY) has witnessed an intervention in its downside momentum after dropping to near 103.80. More downside in the USD Index seems solid as United States economic activities are broadly contracting due to the Fed’s aggressive tight monetary policy and the addition of more filters into credit disbursement procedure used by US regional banks.
US banks seem reluctant in distributing credit to households and firms in order to maintain their asset quality in the turbulent environment.
Meanwhile, mixed views about Fed’s June policy restricting the Gold price from any major action. Higher additions of fresh payrolls in the US labor market in a steady manner bolsters the need of raising rates further while consistently contracting factory activity and sub-normal service activity states that the Fed should pause its policy-tightening for once and observe the impact of interest rates raised yet.
Gold technical analysis
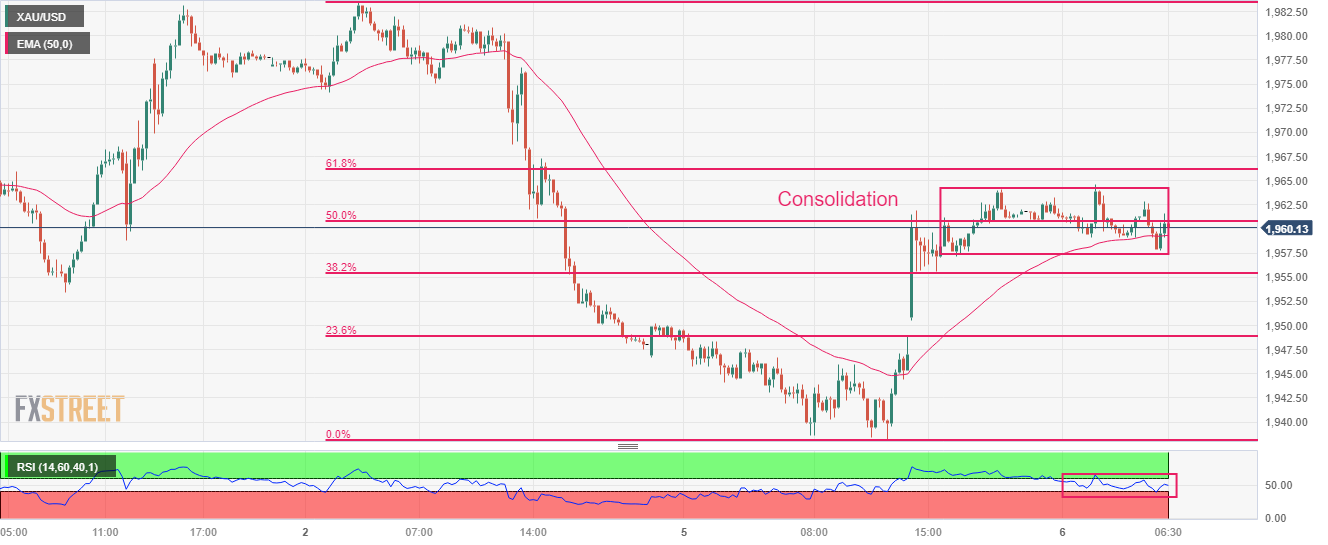
Gold price is consolidating in a narrow range of $1,957-1,964 on an hourly scale. The precious metal has turned sideways around the 50% Fibonacci retracement (plotted from June 02 high at $1,983.50 to June 05 low at $1,938.15) at $1,960.0.
The 50-period Exponential Moving Average (EMA) at $1,959.38 is providing cushion to the Gold bulls.
Meanwhile, the Relative Strength Index (RSI) (14) is oscillating in the 40.00-60.00 range, which indicates that investors await a fresh trigger for a decisive move.
Gold hourly chart