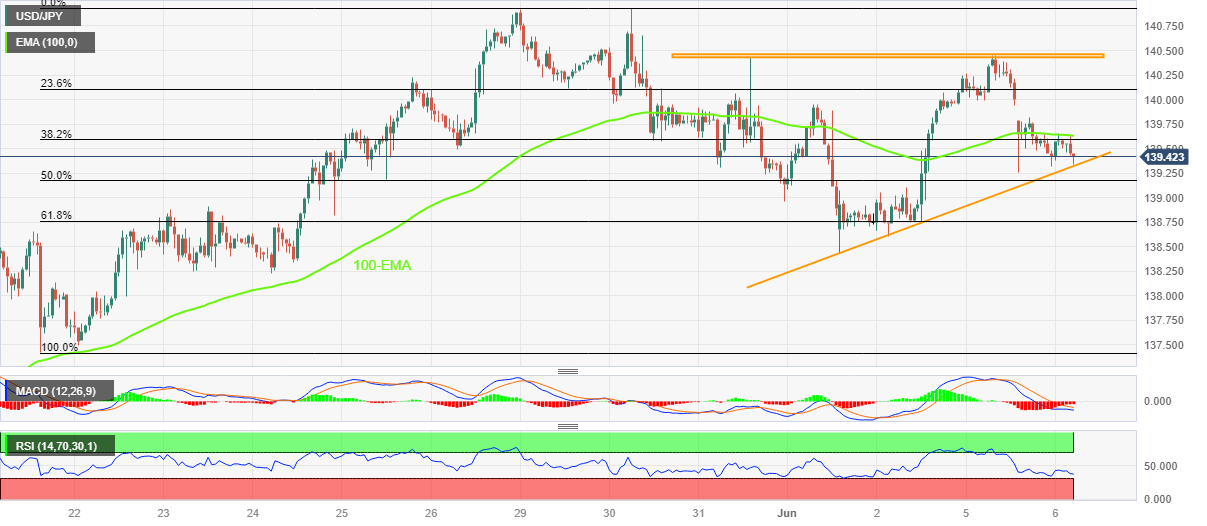
USD/JPY Price Analysis: Bearish triangle highlights 139.30 for Yen traders
- USD/JPY extends previous day’s fall within one-week-old bearish chart formation.
- Sustained trading below 100-EMA, bearish MACD signals favor Yen pair sellers.
- RSI conditions suggest bottom-picking around golden Fibonacci ratio.
- Multiple hurdles stand tall to challenge Yen buyers.
USD/JPY holds a lower ground near the intraday bottom surrounding 139.35 heading into Tuesday’s European session. In doing so, the Japan Yen (JPY) pair defends the previous day’s bearish bias with a one-week-old ascending triangle formation.
Apart from the bearish triangle, the downbeat MACD signals and the quote’s sustained trading below the 100-Exponential Moving Average (EMA) also favor the USD/JPY sellers.
However, a clear downside break of the stated triangles’ bottom line, around 139.30 by the press time, becomes necessary for the Yen pair seller’s confirmation.
Even so, the RSI (14) is near the oversold region and hence the 61.8% Fibonacci retracement of its May 19-30 upside, near 138.75, also known as the golden Fibonacci ratio, can challenge the USD/JPY bears.
In a case where the Yen pair drops below 138.75 Fibonacci support, the 138.00 round figure and the early May peak of around 137.70 could gain the market’s attention.
On the flip side, the 100-EMA level of 139.65 restricts the immediate upside of the USD/JPY pair. Following that, the 140.00 psychological magnet and the stated triangle’s top line near 140.45-50, can challenge the bulls ahead of directing them to the multi-month high marked in May around 140.91.
USD/JPY: Hourly chart

Trend: Further downside expected


