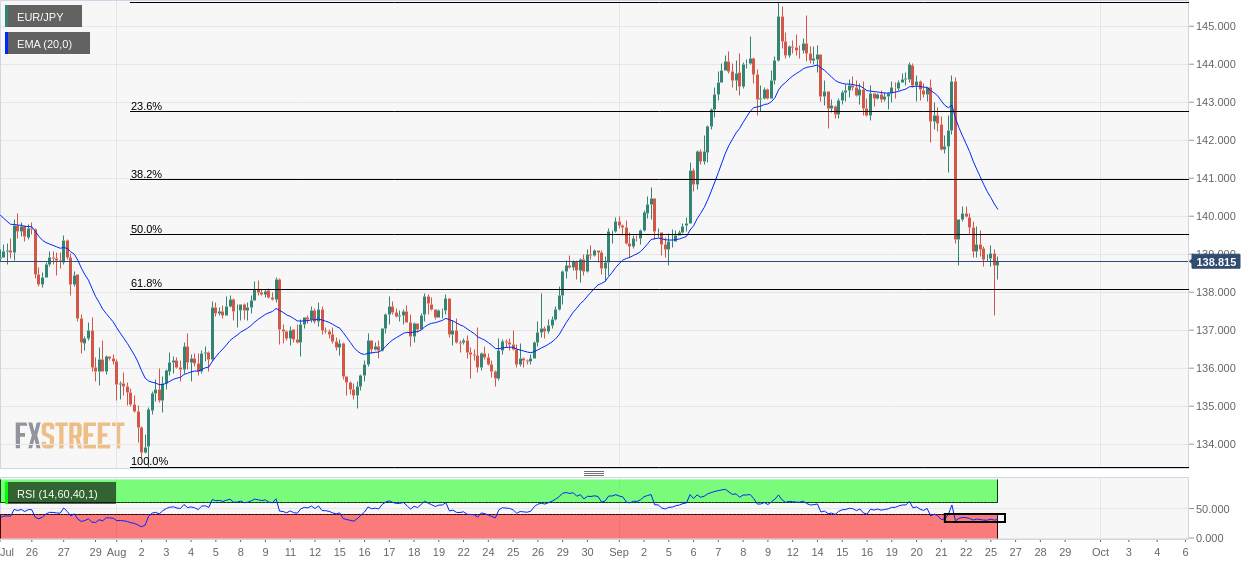
EUR/JPY Price Analysis: Pokes 61.8% Fibo retracement near 138.00
-
The shared currency bulls have defended an establishment below 61.8% Fibo.
-
A sheer decline in the 20-EMA adds to the downside filters.
-
The RSI (14) is oscillating in the bearish range of 20.00-40.00.
The EUR/JPY pair has turned sideways after a pullback move to near 138.63 in the early European session. Earlier, the asset witnessed a steep fall to near 137.50 but rebounded sharply;y and left a buying tail, which indicates a responsible buying market structure. On a broader note, the cross has remained in the grip of bears, therefore, a decent pullback move cannot be ruled out.
Observing the four-hour scale, it is visible that the cross has bounced back sharply after dropping below the 61.8% Fibonacci retracement (placed from August 2 low at 133.40 to September 12 high at 145.64) at 138.00.
The 20-period Exponential Moving Average (EMA) near 140.00 has displayed a vertical downside move, which indicates more weakness.
Also, the Relative Strength Index (RSI) (14) is oscillating in a bearish range of 20.00-40.00, which signals that the downside momentum is aggressive.
A slippage below Monday’s low at 137.39 will drag the cross towards the August 25 low at 136.02, followed by the August 16 low at 134.90.
On the flip side, the shared currency bulls will regain strength and will drive the asset higher if they manage to surpass 50% Fibo retracement at 139.56. This will drive the asset towards September 2 high at140.75 and September 14 low at 142.30.
EUR/JPY four-hour chart